


This is a regular maintenance update to address known issues and security vulnerabilities found in third-party libraries we use in our clients and server code base. There were quite some dependencies to be replaced since our last update. You will find them all listed in the release notes.
Also, we are adding linux aarch64 distribution for servers. It is now available for downloads.
There are no special upgrade instructions, checkout the general guides for updating installed software.
We are pleased to announce the release of version 5.4.2. This maintenance update addresses several known issues and includes upgrades to third-party libraries to resolve reported security vulnerabilities. Thank you for your continued feedback and support.
Please check out the release notes for more details.
There are no special upgrade instructions, checkout the general guides for updating installed software.
![]() Happy New Year everyone and best wishes to all!
Happy New Year everyone and best wishes to all!
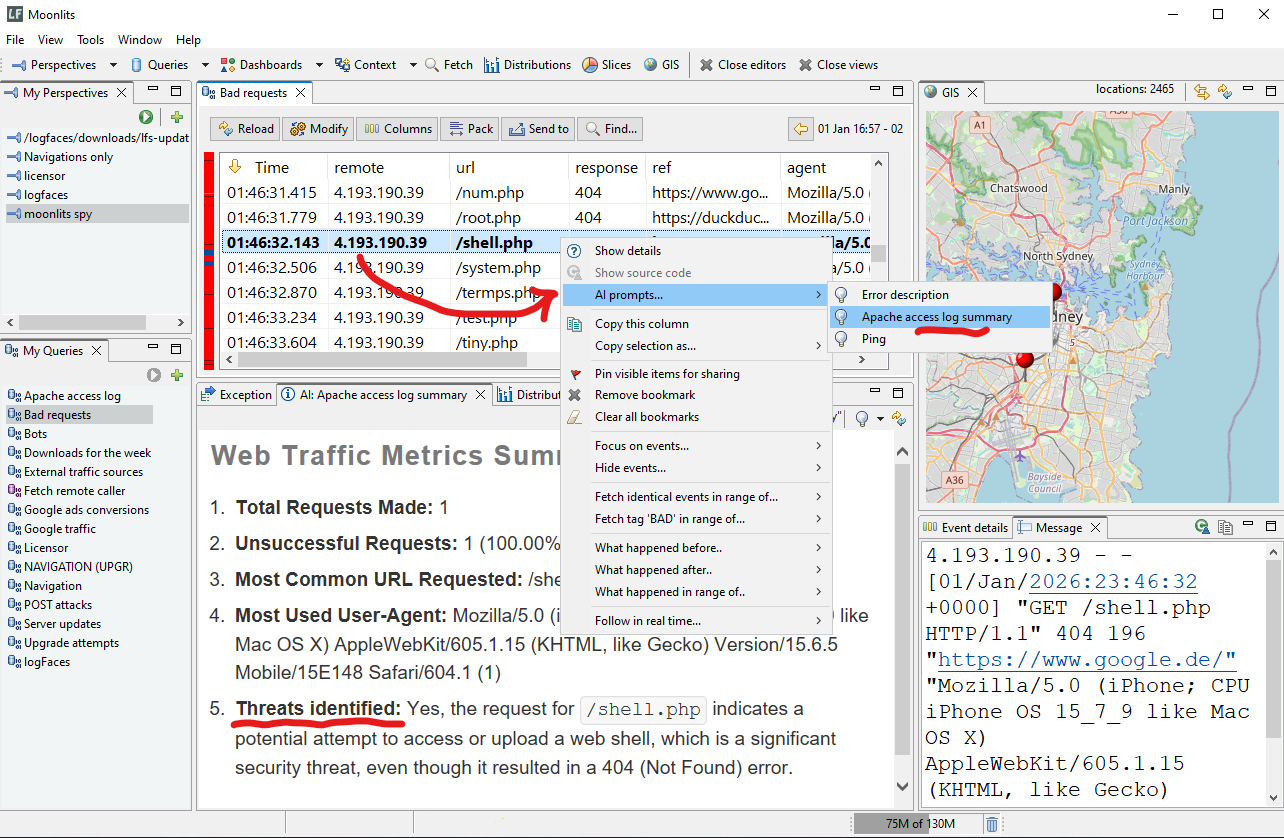
This update introduces a milestone in our roadmap — AI Integration. We wanted to provide our users with smarter tools to interpret, summarize, and diagnose logs in real-time. This year, our focus has been on bridging the gap between raw log streams and actionable insights using Large Language Models (LLMs).
Here is a look at what’s new:
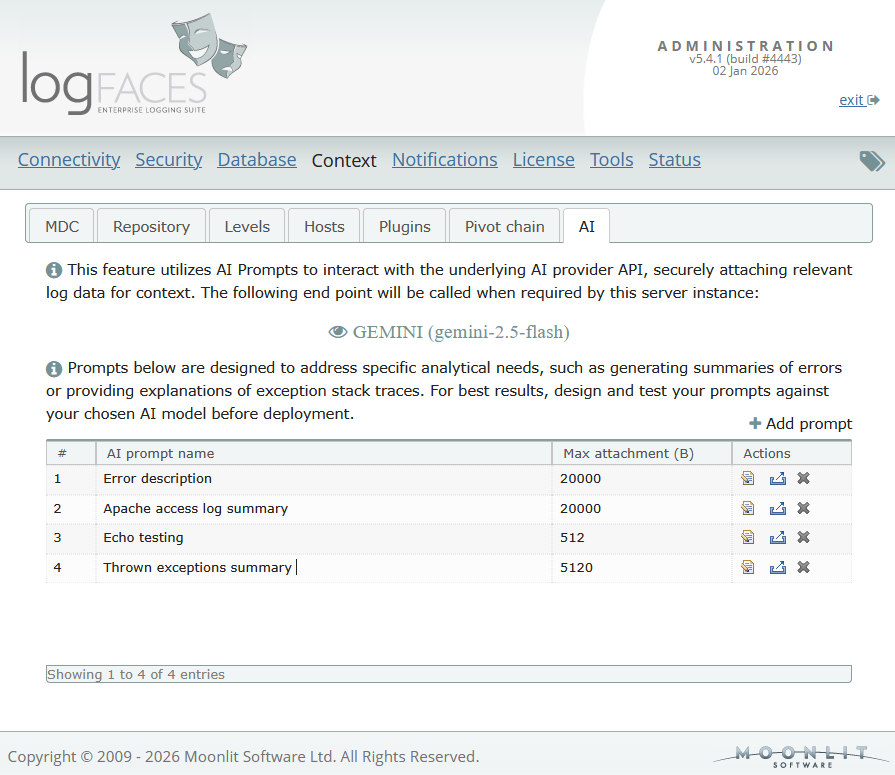
- Native AI Provider Support: logFaces now integrates out-of-the-box with leading AI services, including Google Gemini and OpenAI ChatGPT. Through the administration interface, you can configure API endpoints, manage keys, and fine-tune model parameters.
- Custom AI Prompts: We’ve introduced a prompt administration. You can now design and store environment-specific prompts—such as "Exception Analyzer" or "Daily Summary"—tailored to your specific stack. These prompts are sent to your chosen AI provider alongside relevant logs.
- Reports and Triggers can now utilize AI prompts to generate email summaries.
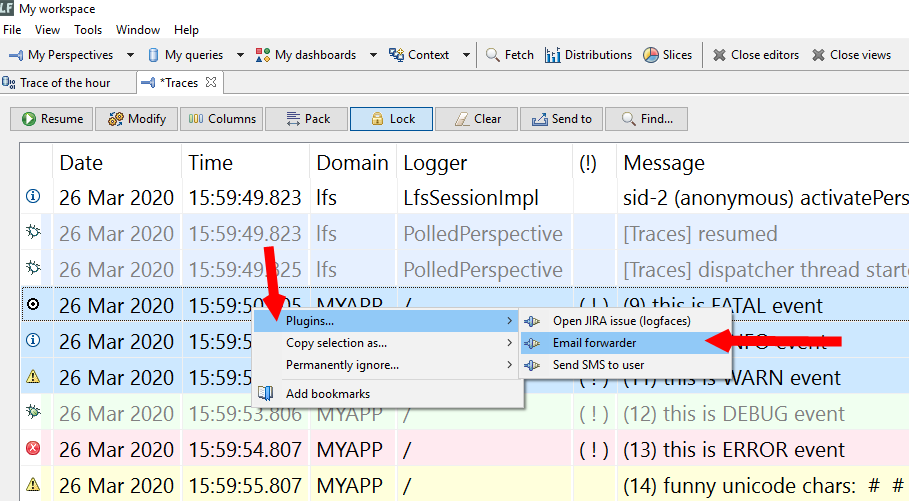
- Client Analysis: By right-clicking on a log entry, users can request an AI interpretation. Results are rendered in a dedicated context view, making complex technical errors easier to read and resolve.
- Cost & Latency Controls: To prevent unexpected API expenses, we offer granular controls for "Max Attachment" sizes and "Output Token" limits, ensuring the server stays efficient and within budget.
This release also includes the usual round of maintenance updates, security patches, and performance improvements. You will find more technical details in the user manual for this release.
Check out the release notes and the upgrade instructions.
We are excited to see how you utilize AI to speed up your troubleshooting workflows. As always, your feedback is welcome!
Recently users have reported security vulnerabilities in our distributions detected using various scanning tools.
This release addresses this concern, we have upgraded the main dependencies to bring the entire code base up to date. Even though there are no functional additions to logFaces, this release is very important for us to stay current and move forward.
To make this upgrade possible, we had to go through an interim release 5.3.2, which we posted in May. This involved replacement of the installation module and the core components such as:
- - Java Runtime Envrionment, moved up to 17
- - Jetty embedded web server
- - Hibernate for SQL databases
- - Spring framework, security and LDAP modules
- - Quartz schedulers
- - Database drivers
- - and numerous other dependencies such as Apache commons, etc.
Check out the release notes and the upgrade instructions.
This is an interim update in preparation for version 5.4 release later this fall, which will be a major upgrade to the underlying dependencies.
We will be retiring JRE 11 because it has reached End Of Life. All existing installations will be migrated to JRE 17 and for that we need to use this interim release to take care of the migration.
There are no functional changes, only preparations for the next update and some minor bug fixes. Please note that it won't be possible to upgrade to later versions without this interim release.
Check out the release notes and the upgrade instructions.
This update addresses vulnerability CVE-2024-38821 found in Spring Security dependencies used in logFaces server. It is a bening issue because we don't really use the affected functionality.
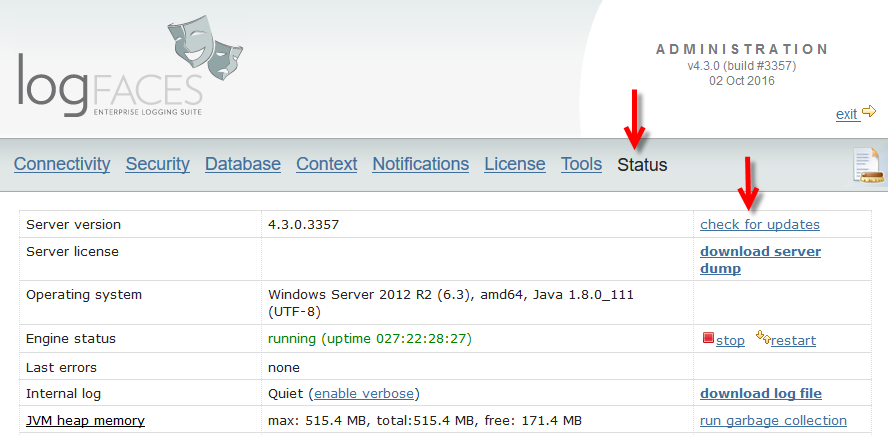
However, if you use jars scanning or validation tools in your environment then this update shall remove the red flags. This update can be installed online using admin status page.
Happy New Year everyone and best wishes to all.
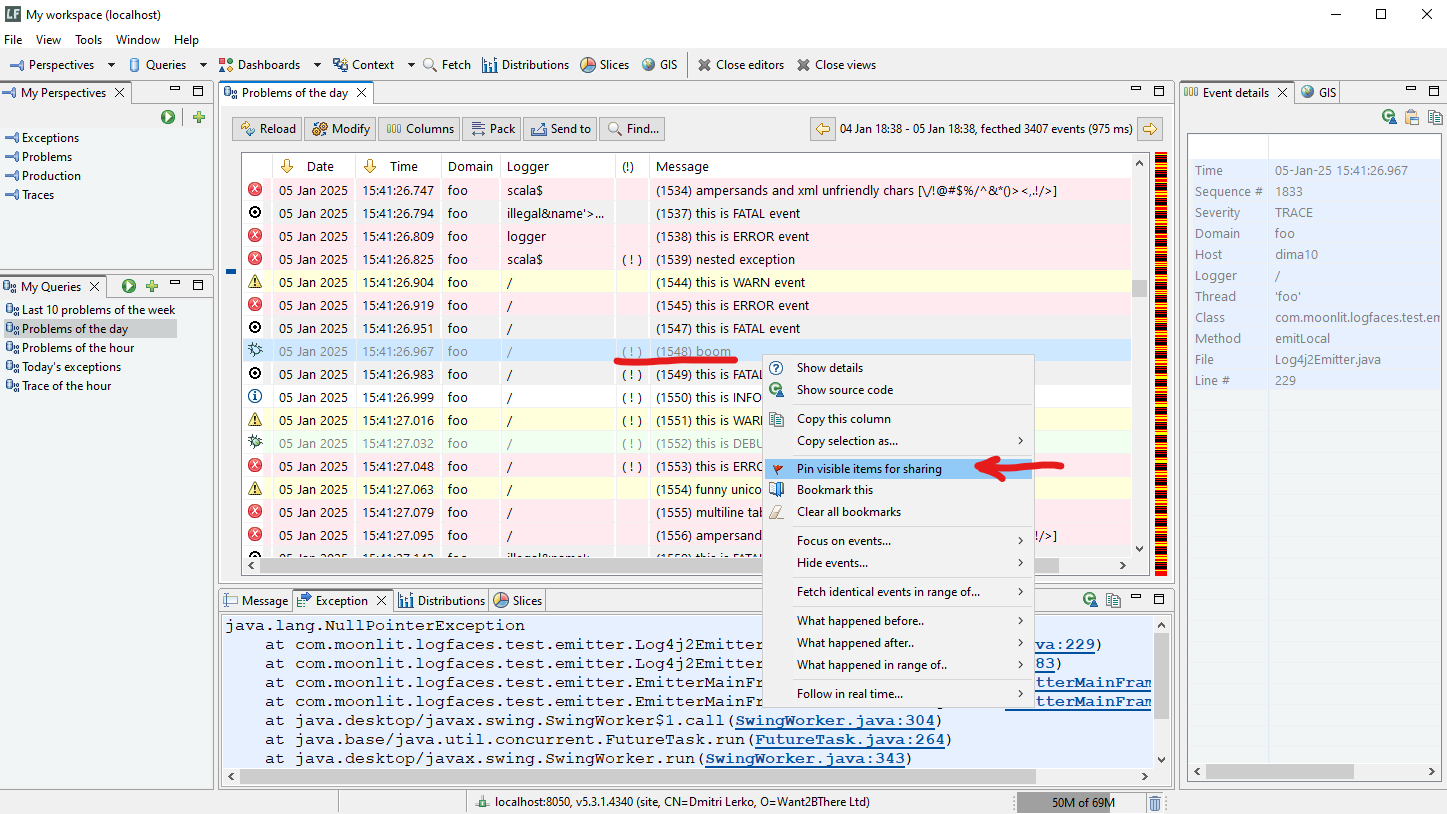
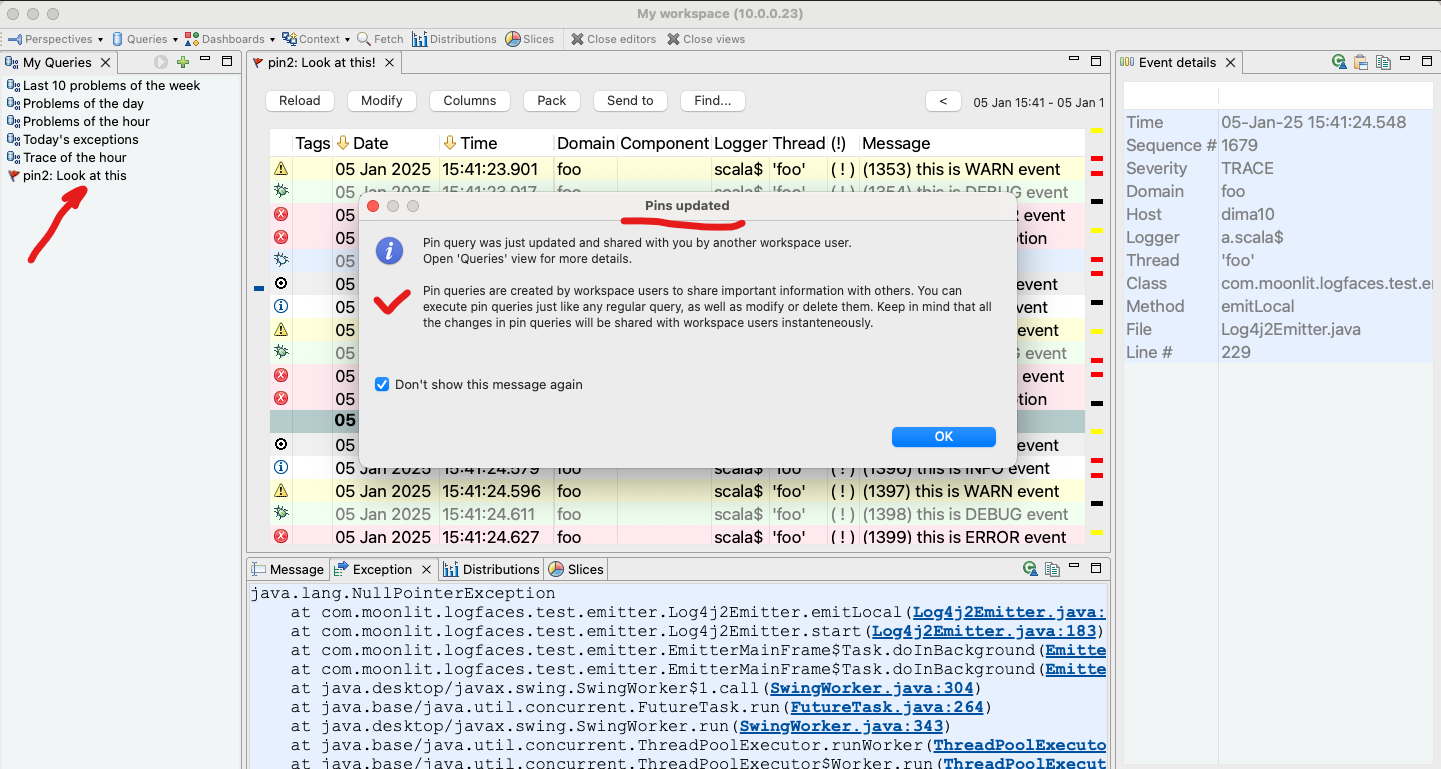
A noteable addition today is the feature we named The Pins, quick data queries shareable amongst other team members. Why?
Imagine that you stumble upon something in your logs and want to "pin" that down to show others. You right click on it and create the pin. Others will be notified about the new pin or see it later when they connect. Then it's just a regular query for further investigation. Use it, modify it, remove it when done. Simple and effective collaboration tool.
As usual, there are also some minor improvements and bug fixes we normally do for the maintenance. Check out the release notes for more details.
There are no special upgrade instructions, checkout the general guides for updating installed software.
This functional update comes to improve logFaces and the Google BigQuery integration. Since our first release few years ago this feature was hardly touched. It's about time we've given it a face lift in terms of performance with larger data volumes. Those of you using this data storage will notice a difference. Also, we have added a new transport based on highly consurrent binary streams. This method is significantly faster and more robust. It will be superseding the legacy REST API calls we used so far. It is entirely possible that Google may depricate these API's in the near future. Note, however, that for now the legacy transport will continue to work as usual. The newer projects are recommended to use the streaming API. You will find more technical details in the user manual for this release.
Starting from this release we will no longer support log4 v1 in our Java appenders package because it has reached End of Life and community will no longer fix the vulnerability issues which still pop around every once in a while. If you are still using log4j v1, our Java appenders v5.2.3 is the latest one you can use with log4j v1. Our appenders for log4j v2 are in active support going forward.
As usual, there are also some minor improvements, bug fixes and upgrades we normally do for the maintenance. Please check out the release notes for more details.
There are no special upgrade instructions, checkout the general guides for updating installed software.
Hello everyone! Here we come with our maintenance update to start the year. There are some improvements and bug fixes. Please check out the release notes for more details.
There are no special upgrade instructions, checkout the general guides for updating installed software.
We are happy to bring up logFaces to v5.2.2 with this maintenance update addressing some issues and improvement requests known to date. Thank you all for your feedback and support!
Please check out the release notes for more details.
There are no special upgrade instructions, checkout the general guides for updating installed software.
Hello everyone, we are happy to announce the maintenance update v5.2.1 with bug fixes known to date.
Please check out the release notes for more details.
There are no special upgrade instructions, checkout the general guides for updating installed software.
Happy New Year everyone and best wishes to all!
It gives us great pleasure to announce the release of logFaces version 5.2 for the upcoming year with new additions, improvements and bug fixes. The noteble new features include:
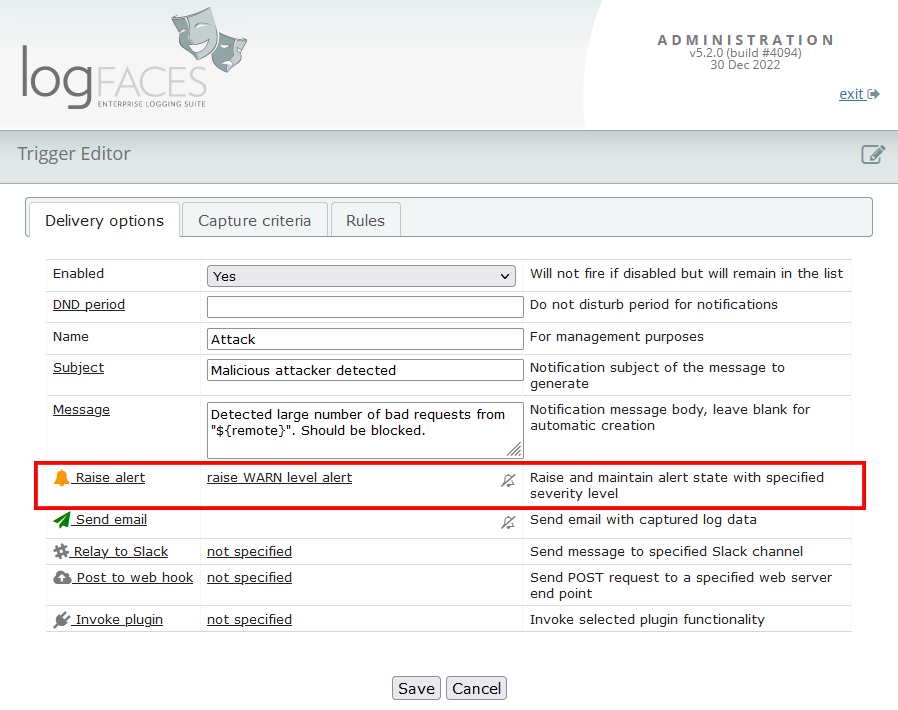
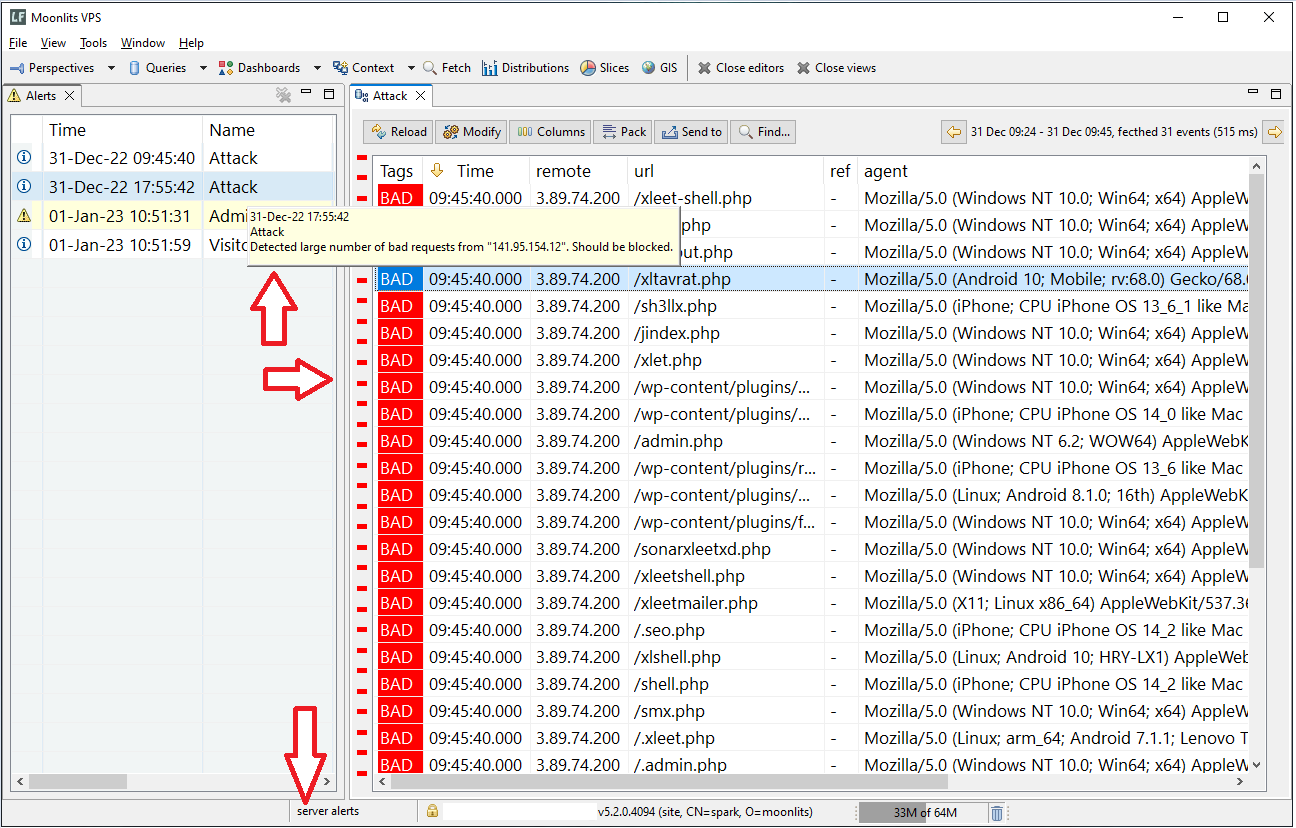
Alerts
This extends our notification triggers with a new capability. Alerts are displayed on client UI to raise awareness of past trigger events. Users can query the Alert related logs and acknowledge them if needed. Alerts are persistent inside server instance and visible to all authorized users until acknowledged.
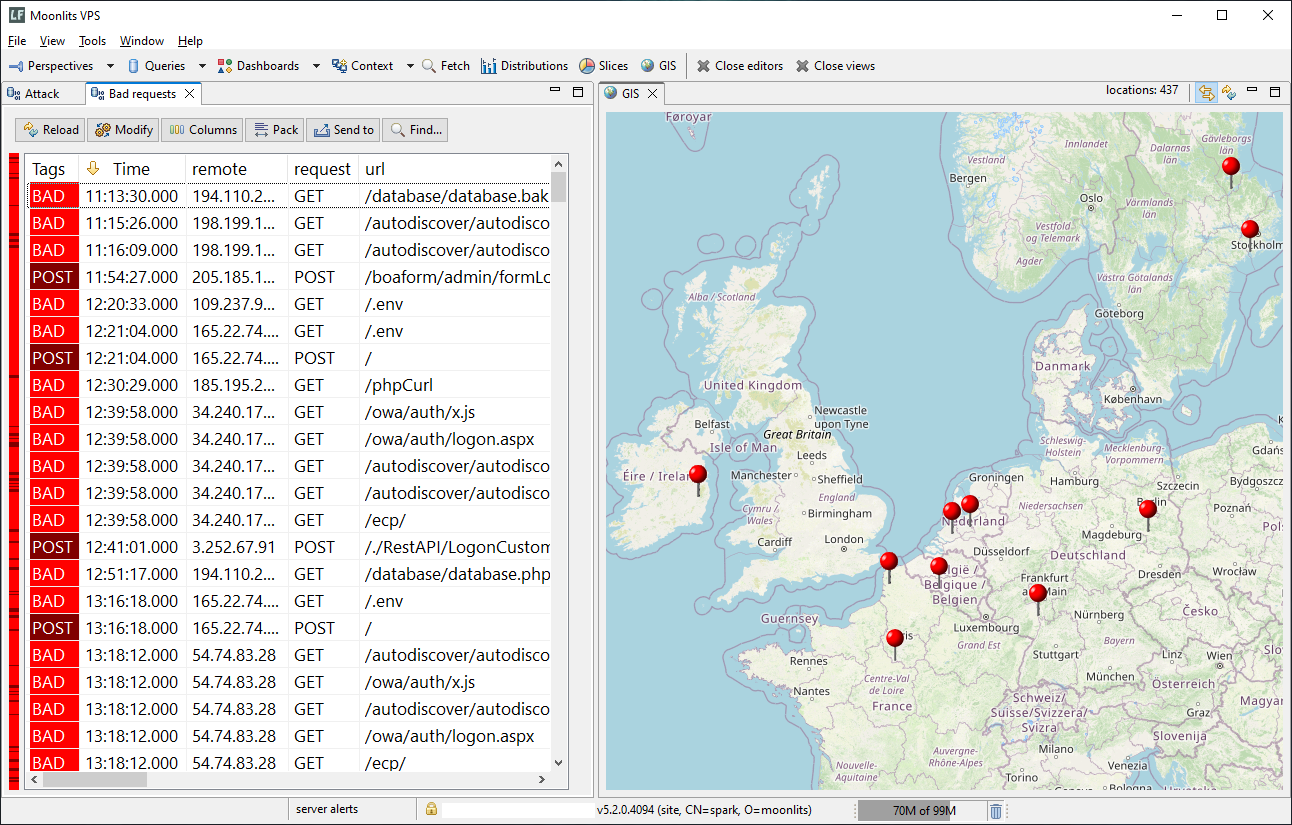
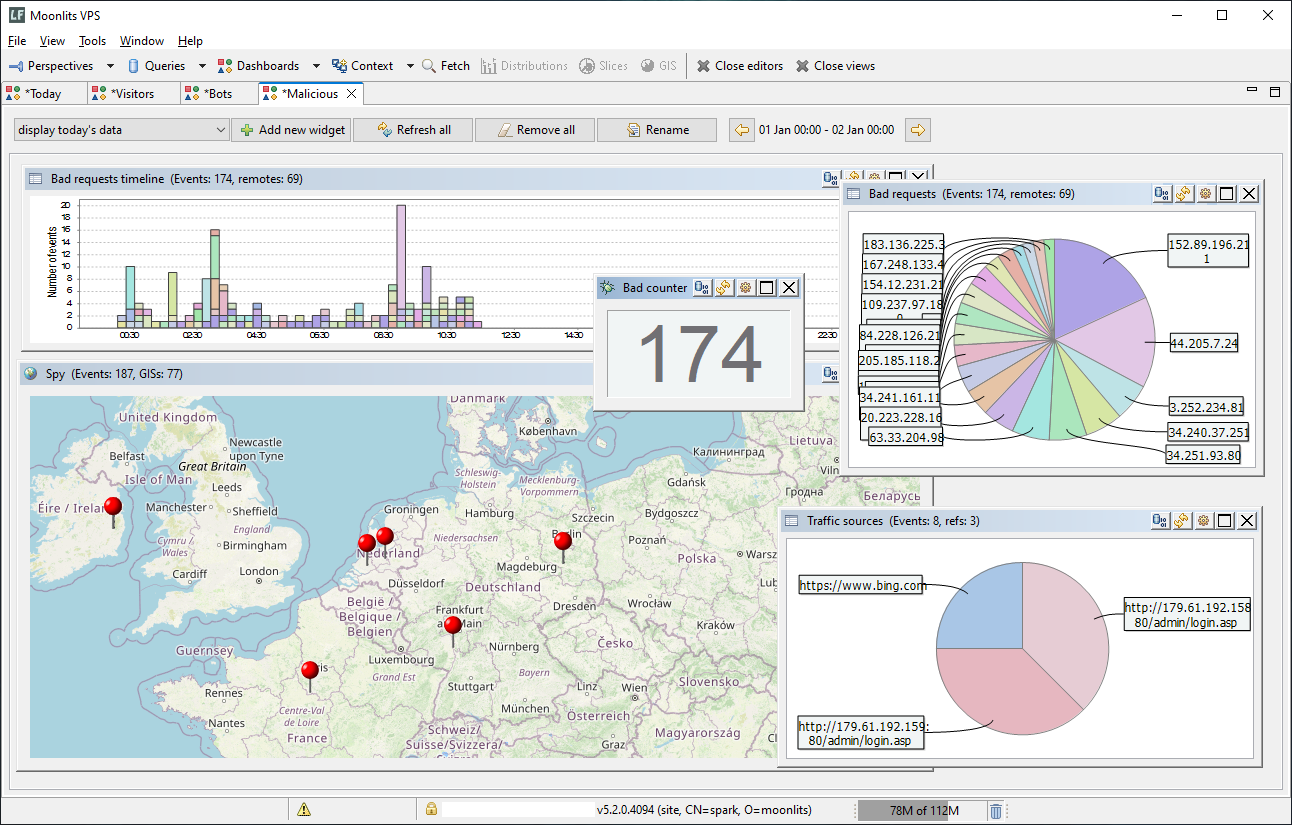
Geolocations
If your logs include IP addresses you can now visualize them on a map. This is an experimental feature, we would like to see how it will be received. Currently it is based on a Groovy plugin we created to easily resolve IP addresses to coordinates. Clients have a view called GIS for visualizing the log data. We also added a special widget to our dashboards so that you can incorporate geolocations there. Currently available for Windows clients only.
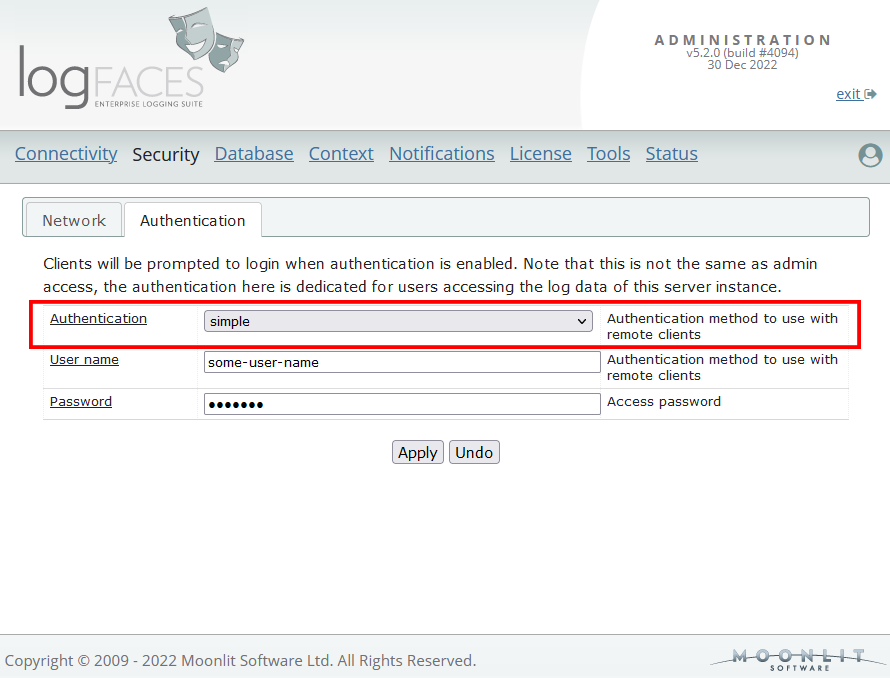
Simple Authentication
We are extending authentication options by enabling a simple user name / password authentication type for those who don’t have LDAP servers or want to have less complicated set up. When enabled, all connecting clients will be prompted to login.
Java 8 End Of Life
Please note that Java 8 has reached End of Life. Starting from this version the Long Term Support is JRE 11 which is included by default into server distributions. We have also upgraded numerous dependencies such as Jetty (our embedded web server), Spring framework, Email, and other open sources libraries.Check out the release notes for more details. The upgrade instructions are here.
Hello everyone, we are happy to announce the release of logFaces v5.1.1.
This is a regular maintenance update with bug fixes known to date and some improvements, please check out the release notes for more details.
There are no special upgrade instructions, checkout the general guides for updating installed software.
As M1 Apple computers are becoming more common we are adding logFaces clients distributions for MacOS ARM architecture. It is still marked as beta in our downloads but it is fully functional and ready for use.
As usual your feedback is welcome.
Happy New Year everyone and best wishes to all!
We are pleased to announce the release of logFaces v5.1.
We have added support for Graylog GELF format which is quite popular these days. Hopefully you will find this addition useful, the user manual contains more details if you wish to dive in.
There are also improvements and bug fixes known to date. Important to note that we have upgraded the log4j2 dependencies and retired older binaries in the context of recent vulnerabilities detected in this open source project.
For more details please check out the release notes. There are no special upgrade instructions, here are the general guides for updating.
Looking forward to hear your feedback!
On December 9th, 2021, a new 0-day vulnerability in the popular Java logging package log4j v2.x was announced. The vulnerability is particularly unpleasant as exploitation frequently requires only the ability to cause the system to log an attacker controlled string to a vulnerable logging instance.
How it affects logFaces?
The short answer - it doesn't. We are using our own forked and reduced version of log4j based on version 1, this is essentially different code base. So, there are no capabilities which appear to be vulnerable - there are no JNDI/LDAP features used in configuration and there are no ways to extract variables or parameters from logged messages.
Howerver, if you are using our Java appenders in your applications then please make sure that your dependencies use log4j2 v2.15.0 and above. We don't distribute these jars. We will update central Maven repositories to include latest log4j2 in dependencies later this week.
We are closely monitoring the situation, let us know if you have more information about this issue. Stay safe!
This is a short organizational notice. We have upgraded and replaced our payment processor, so don't be surprised if maintenance reminders point to a new vendor URL.
Our payments are now handled by Paddle platform and we hope this will be an improvement to invoicing, money transfers, and other related activities. Support can be reached here.
It's about time this part of the product had a fresh look

Hello everyone, logFaces v5.0.3 is released. This is a scheduled maintenance update with bug fixes and improvements, please check out the release notes for more details.
There are no special upgrade instructions, checkout the general guides for updating installed software.
Happy New Year everyone and best wishes to all in these strange times...
Here we come with our regular scheduled maintenance update, fixing the issues reported to date and improvements.
For more details please check out the release notes. There are no special upgrade instructions but check out the general guide.
Looking forward to hear your feedback!
Last week release of MacOS Big Sur cought us by surprise - our client apps became incompatible.
We are an Eclipse based application, so we had to bring all the dependancies in order to get back on track. Those of you who upgraded to MacOS Big Sur, please re-install the logFaces client from this link. We will be posting an orderly maintenance release later this month but for now the above version should get you going uninterrupted.
Please note that logFaces client is not yet notarized with Apple as it comes from outside the Apple store. Signing the apps as their registered developer is not enough anymore. We have to undergo another "notarization" process with Apple which takes time. So, for now, when you download the binaries, feel safe to ignore the Gatekeeper warning. Go to security preferences on your Mac and permit the app to install.
We are delighed to inform you that logFaces succesuflly arrives at version 5 after few months of beta testing at several sites.
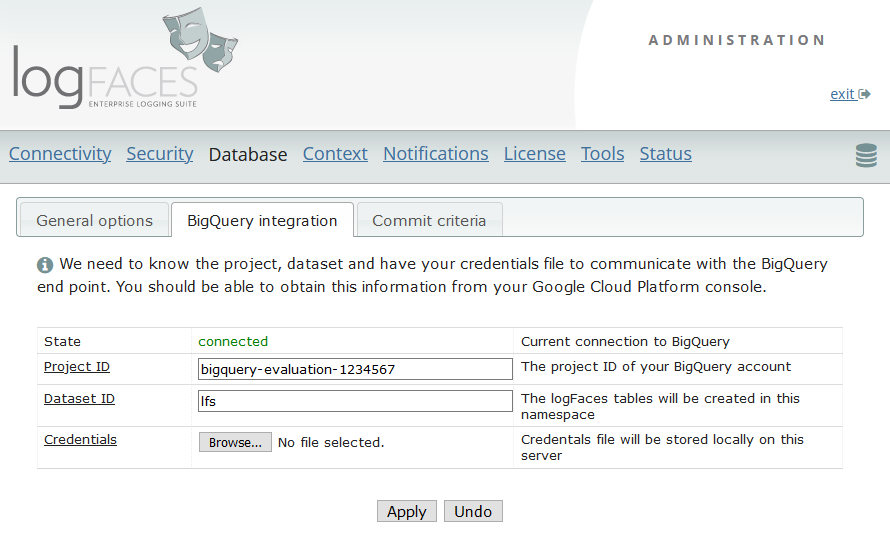
As mentioned previously, we wanted to add Google BigQuery as our additional type of data store. This should help us address scalability, improve query response times and reduce database maintenance costs.
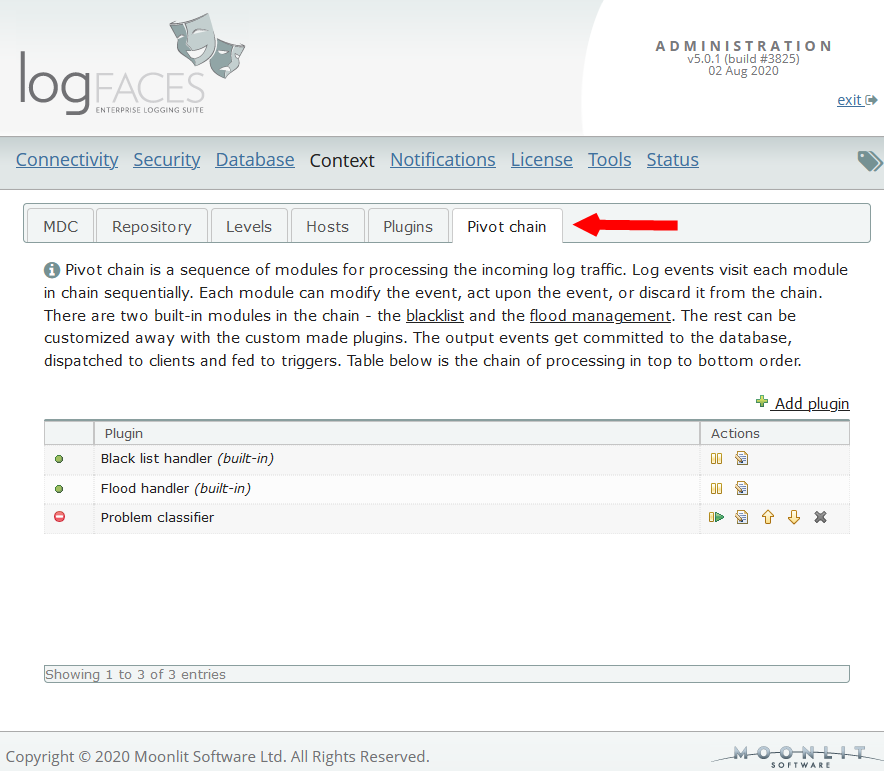
Additionally, we introduce plugins for extending logFaces functionality on client as well as server sides. Client plugins can be used to integrate better with your domain. Server plugins can be used to control the log traffic going through the server. Here is a small demonstration.
Both features are now stable and ready. The user manual contains lots of details if you wish to dive in. Look for keywords bigquery or plugins to get around fast.
Even though this is a major release, the new features should have no impact on existing installations unless explicitely enabled. This makes it safe for the upgrades in most cases. There are also smaller improvements, fixes and compatibility updates.
For more details please check out the release notes. There are no special upgrade instructions but checkout the general guides for updating.
We are looking forward to hear your feedback!
We are happy to announce a public beta for logFaces v5. The release is planned for the second half of this year. Current stable v4 will continue as usual, until eventually replaced by v5. We do our best to keep the backward compatibility to slowly fade into the new version. The v5 additions are isolated and should not affect existing installations. This is what we have:
New storage type - data warehouse
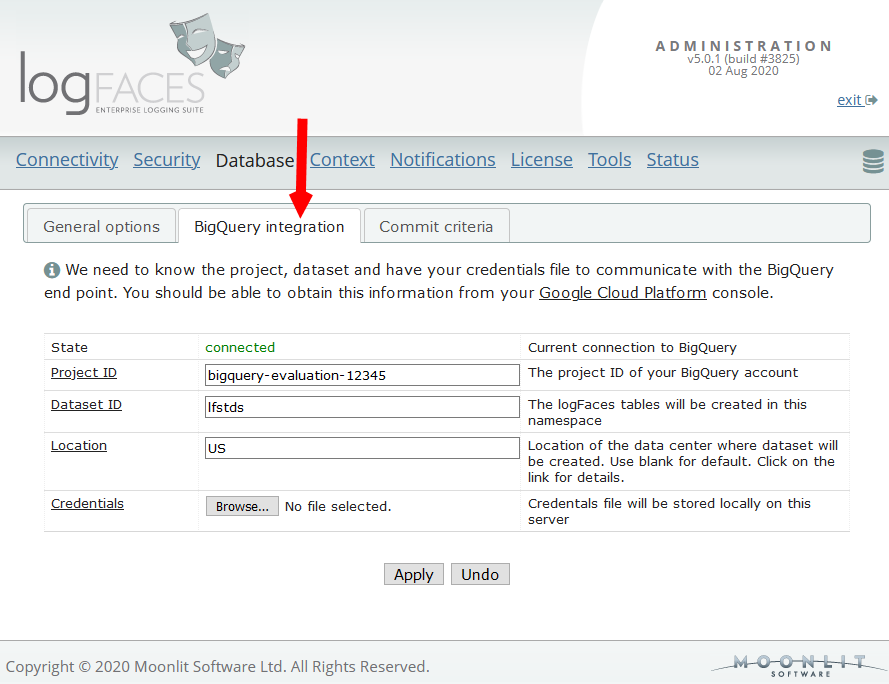
We are adding support for Google BigQuery as a new back-end storage. Reasons? First, scalability, BigQuery boasts massive scaling capabilities and blazing query speeds. Second, maintenance costs, when outsourced into the cloud, there is less hassle in dealing with your databases at home. This could be a boon, depending on how you look at it or who you ask.
Note that this service is not free as it works with your Google account. However, reducing costs is always a trade-off. We want to start working with this kind of services and see how it unfolds. The user manual contains detailed instructions on the integration with the service. (see section 2.10.14 on page 84)
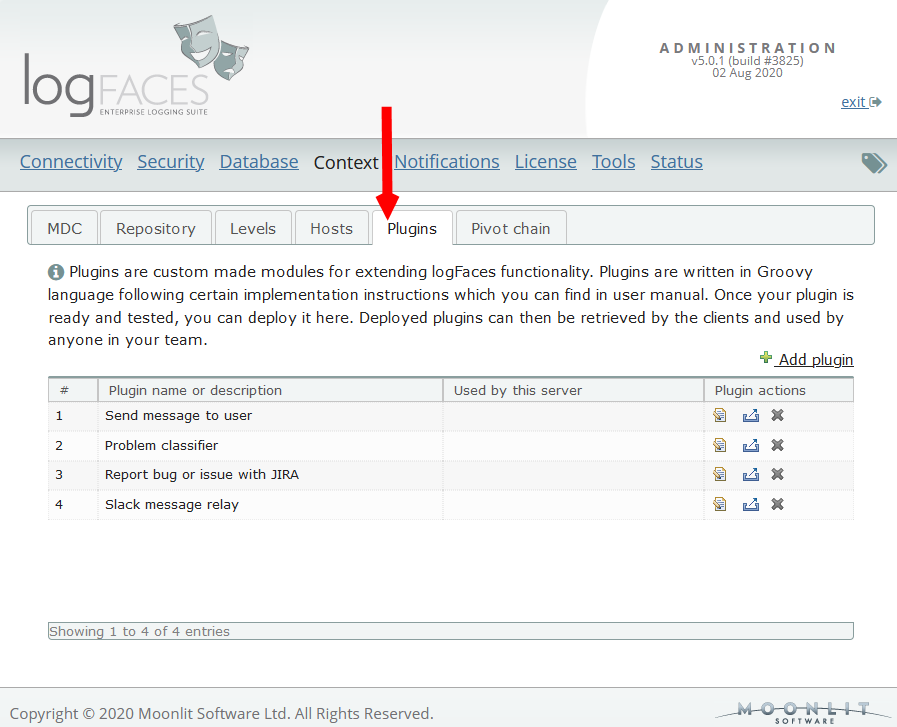
Plugins
There were many requests about extending logFaces functionalities with domain specific functions. Integration with your own systems in the context of the log data is a boundless field. For example, open a support request in your bug tracking system when you see something odd, contact someone by email or sms, call some back-end service, etc.
Now you will be able to write your own extensions and use them in logFaces clients. Plugins are modules written in Groovy language using the guidelines we provide. The input into the plugin are the log data the user selects. The function you apply to this data is all yours. Groovy is a popular JVM scripting language, which meets a wide audience of developers. In the manual you will find an interface description and other references. (see the very last section)
We are looking forward to hear your feedback!
Happy New Year everyone and best wishes to all!
Here we come with a scheduled maintenance update, fixing the issues reported to date. There was one "small" issue which grew into a big problem in some very specific situations. The bug was related to a repository storage which resulted in repositories growing out of hand and creating unexpected side effects in some systems. Particularly affecting clients. This update fixes this problem.
For more details please check out the release notes. There are no special upgrade instructions but checkout the general guides for updating.
This is it for now.., but we do have a major release planned for this year, so stay tuned!
We are pleased to announce the release of logFaces version 4.6. This update targets the compatibility with the most recent Java runtimes. Java world has come through some transformation in the recent years, and it seems that we have arrived to some stability. JRE 11 has entered longterm support (LTS) stage while JRE 8 enters the End-of-Life stage, so we want to make sure logFaces runs well on anything above Java 8, be it Oracle JRE or OpenJDK. Since we depend heavily on many open-source products, there were some dependencies we had to upgrade. Which is good, we want to stay current.
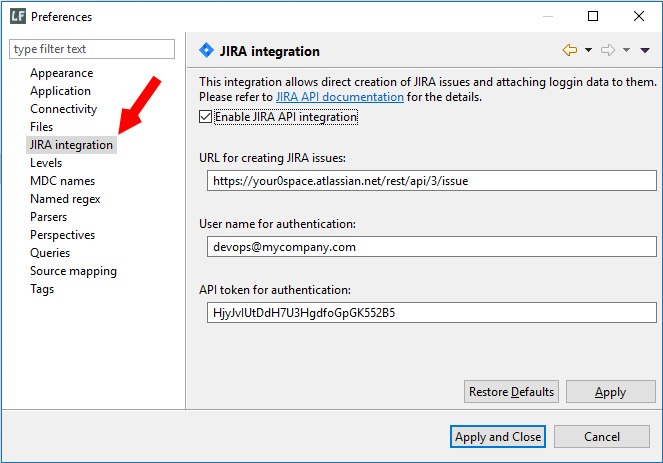
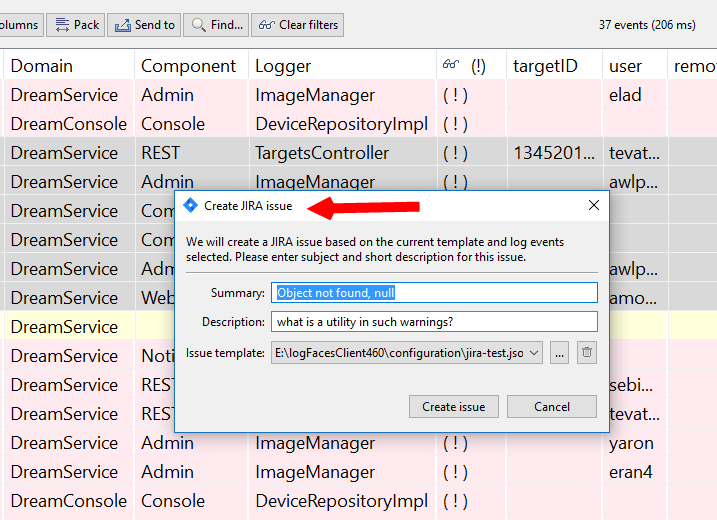
Another noteworthy addition in this release is the integration with JIRA issue tracking system. Now you should be able to create issues directly from logFaces client including the logging context of the problem at hand. We start with basic minimalistic stuff and see if it gets interesting. Send us your feedback if you use JIRA in your development process.
There are also bunch of bug fixes and improvements. Please check out the release notes. There are no special upgrade instructions but checkout the general guides for updating.
As we work these days to migrate to new JRE (11+), two interesting things popped up in relation to MS SQL Servers. I thought I'd share these findings with those of you who use logFaces with this kind of database.
First, the jTDS open source driver we used with SQL Server up to date does have a better config option when it comes to a very large data sets. The default configuration we supply with our installation may not be the best. Something we didn't know about (huge thanks to Brian for bringing this up!). There is a special FAQ with links and references for tech details added.
Second, it's worth to note that this driver is not being updated for few good years, and it's about time we move on. It appears that Microsoft are vigorusly maintaining their own version of JDBC driver, so why not trying them? We did try and it seems to work much better than back in those years when jTDS was a better choice. The tests we conducted indicate that there is no problem using this driver with logFaces going forward, and this is what we intend doing. Here is another FAQ with details on how to setup this driver with logFaces. It can be done with the current version of logFaces server if you wish to give it a try. And if you do, please give us your feedback!
Maintenance update v4.5.1 is out. There are few bugs killed and some improvements added, please check out the release notes. There are no special upgrade instructions but checkout the general guides for updating.
Happy New Year everyone and best wishes to all !
As we always do at the beginning of the year - the software updates for the clean start. This time it's a minor version increment to 4.5. Here is the short list of most noteable updates:
- Starting from this release, all receivers we currently support are extended to work over SSL. We have also added SSL capabilities to our Java appenders to stay aligned.
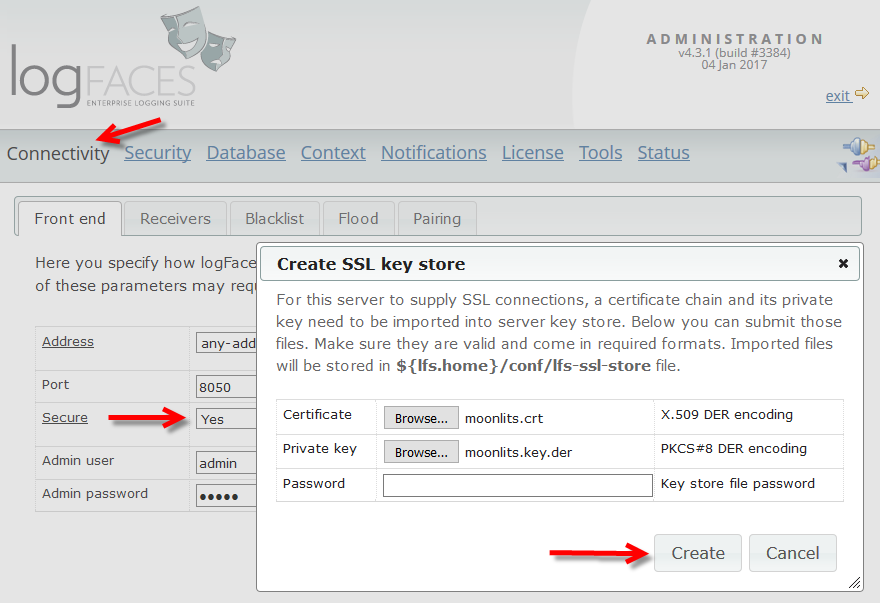
- We have significanly improved server administration when it comes to using SSL. It is now much easier to configure server instance to operate over SSL. Creation of self signed certificates is added to simplify development environments.
- Starting from this release, the minimum requiremens for our server installations are lifted to JRE 8+. Since Java world has moved to version 11 LTS recently, we believe it is safe to retire Java 7 and move on. If you are still using JRE versions prior 8, please do not update servers without lifting up your JRE first.
- In the spirit of keeping up with other open source projects, we also upgraded Jetty web server, Hessian library, MongoDB drivers and some other minor dependancies to be up to date.
- There were quite some bug fixing this time, it was a while since we posted an update, so things get piled up a bit.
Check out the detailed release notes. Upgrade instructions are here.
We are correcting some pressing issues reported in admin interface and some other annoying bugs detected on server side. The release notes are here. No special upgrade instructions today, but do check the general upgrade guides.
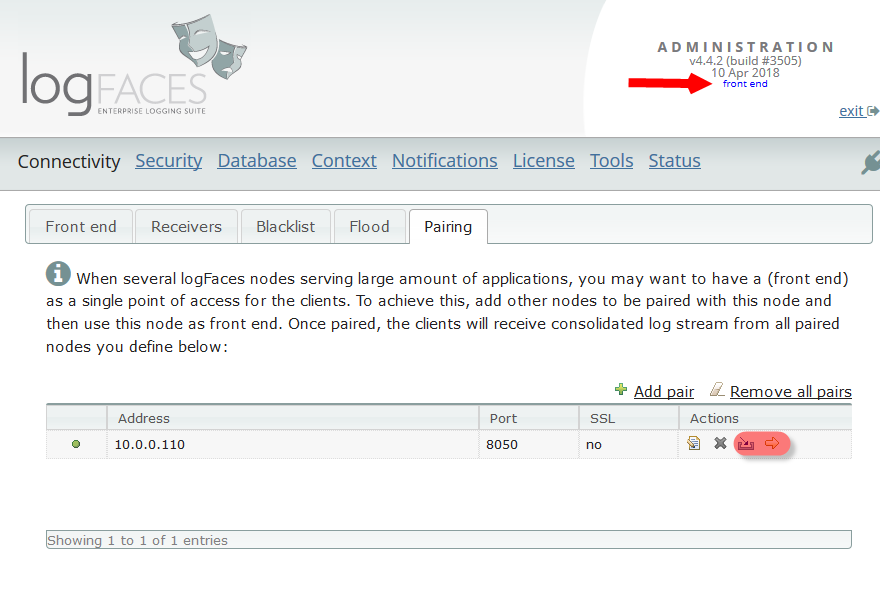
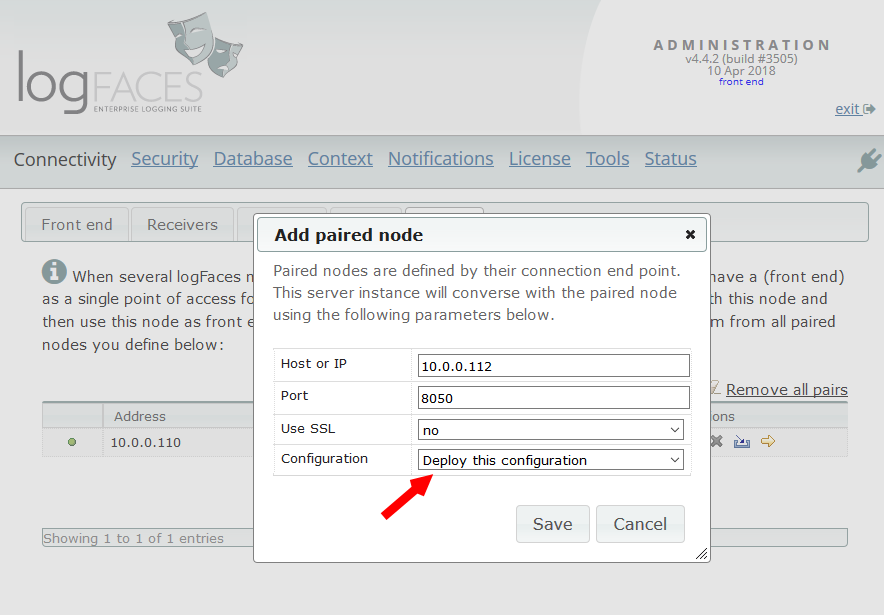
We are happy to bring logFaces up to v4.4.2. This is a regular maintenance update correcting bugs reported to the date and improving several pending items.
This time we touched the pairing mechanism of server nodes. We redesgined some of the aspects of administration related to pairing to make it more intuitive. You will see less functions on back end nodes because it is done on the front end node only - for example database setup, security, etc. Triggers and reports which were scattered on different nodes are now managed and function at one place - front end. It is now very easy to setup back end nodes by deploying front node configuration.
There are some other minor improvements and fixes, please check out the release notes. There are no special upgrade instructions but checkout the general guides for updating.
Happy new year everyone! And here we go again :)
We are happy to release a new version today. Moving forward to 4.4 series. Minor version increment is because we upgraded some internal components, read below.
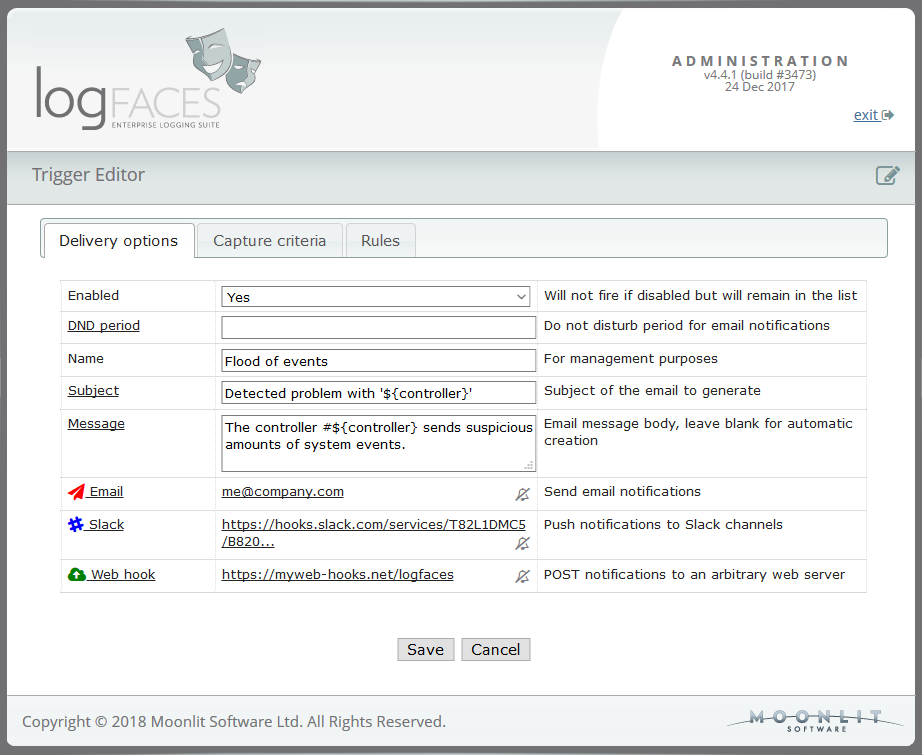
New things first - starting from this release the real-time triggers can be integrated with Slack as additional destination. It means that along with emails, some notifications of your choice can be forwarded to Slack channels as well. Integration is fairly simple, all you need to have is the web hook URL and the name of the channel you want the trigger to talk to. Each trigger can use different hooks and channels, so it should be fairly flexible for most Slack users.
And while at it, we also added an option to POST notifications to an arbitrary web service of your choice. It will be a JSON payload - a subject and message defined for the trigger.
This update is a minor version increment as we renewed some ageing components. The web server and everything related to it was replaced. logFaces is using Jetty 6 which arrived to its end of life, so it was time we moved up to the latest Jetty 9. It's better performing, modernized and will give us room for further developments.
We also upgraded database drivers, client runtimes (Eclipse Oxygen), fixed all known bugs and improved some things here and there. Please check out the release notes for more details. No special upgrade instructions with this release. Latest user manual is here.
The noteworthy item in this release is a public REST API exposing server functionality over HTTP. This interface is designed for a wider audience than our existing Java API. It should appear fairly standard for those of you familiar with REST interfaces and logFaces functionality. API documentation can be found in user manual.
Additionally, there are many client improvements in terms of stability and performance. Please check out the release notes for more details.
Starting from this release, the minimum requiremens for our server installations are lifted to JRE 7+. Upgrade instructions are here..
-------
Something unrelated to this release but might be useful for some...
We stumbled upon an interesting usage of logFaces during development of mobile apps in some of our internal projects.
If you are developing for the Android, there is a way to forward its internal logs to logFaces in real time.
This helped us to uncover some interesting stories coming from the bottom of this OS.
We are happy to bring up logFaces v4.3.2.
This is a scheduled maintenance update correcting bugs reported to the date and improving several pending items. We get better with every update!
Please check out the release notes. There are no special upgrade instructions but checkout the general guides for updating.
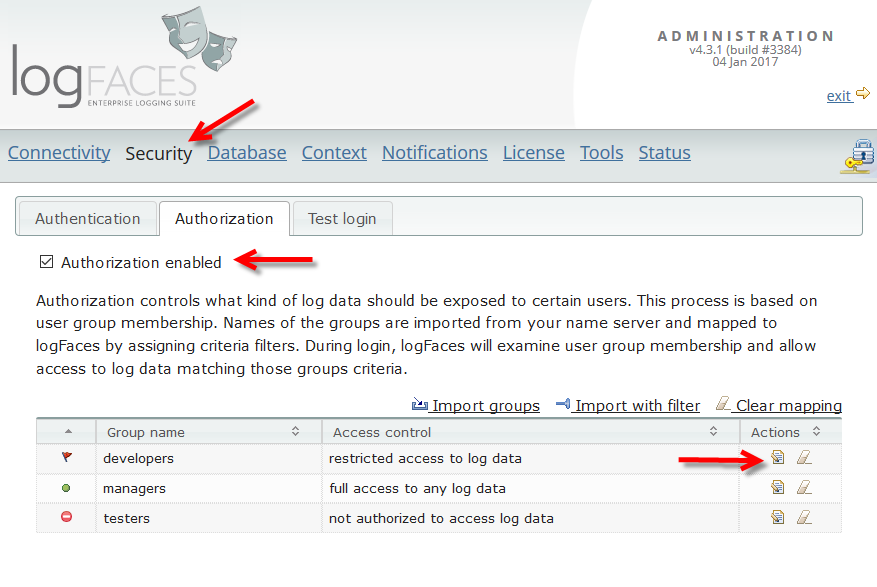
Happy new year everyone and welcome to logFaces 2017 which starts with 4.3.1 release. This update is focused on security, but as usual we kill the bugs you report.
Here's a brief overview:
- We have completely re-designed the authorization mechanism. Now it is possible to authorize log data using our standard criteria filters. Existing configurations shall be automatically migrated, no intervention is needed, but if you use authorization make sure to check migration.
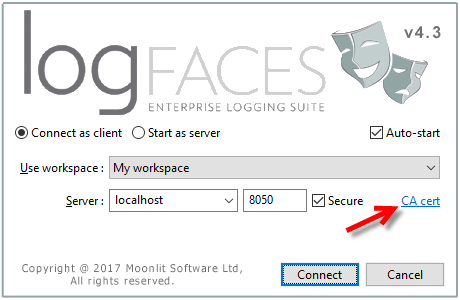
- The integration of SSL into the server was improved by enabling import of certificate chains and private keys directly from admin without using any external JDK tools. Also, the clients can now import server certificates in case their JRE doesn't have proper keys. Those additions also make it possible to use self-signed certificates which is a good news for development environments.
- There are some visual touches. Admin is improved to render consistent fonts and layouts in different browsers. We fixed splash screens on Linux clients so now it looks consistent. All clients should perform better as we tuned some latest eclipse launch parameters.
- General improvements and bug fixes, some are quite annoying, make sure to upgrade soon.
Stay up to date with the user manual. Please see instructions for safe upgrade.
Here we come with some new stuff, logFaces moves into 4.3.
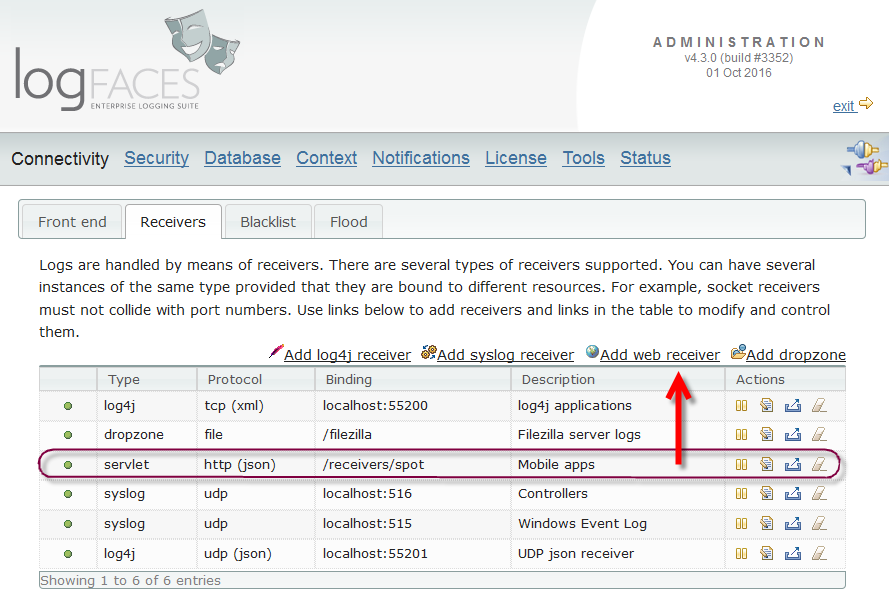
Recently, we've gotten into the development of fairly complex JS apps. It was one of those cases when no logging equals no delivery. We needed real-time logs from a hybrid mobile Cordova application to debug and test on various platforms, and at various locations. It is known that logging from browsers is technically very limited; the only way out of the browser sandbox is through HTTP. This is why web receiver was born. It handles cross domain POST requests. Each receiver maps to a URL defined by you and it handles the logs like any other receiver. We have also added a helper JS module for starters, but you can use your own clients to post the logs, it is a fairly simple format. This opens doors to a lot of new clients we want to embrace. If you do mobile app development, you must check it out.
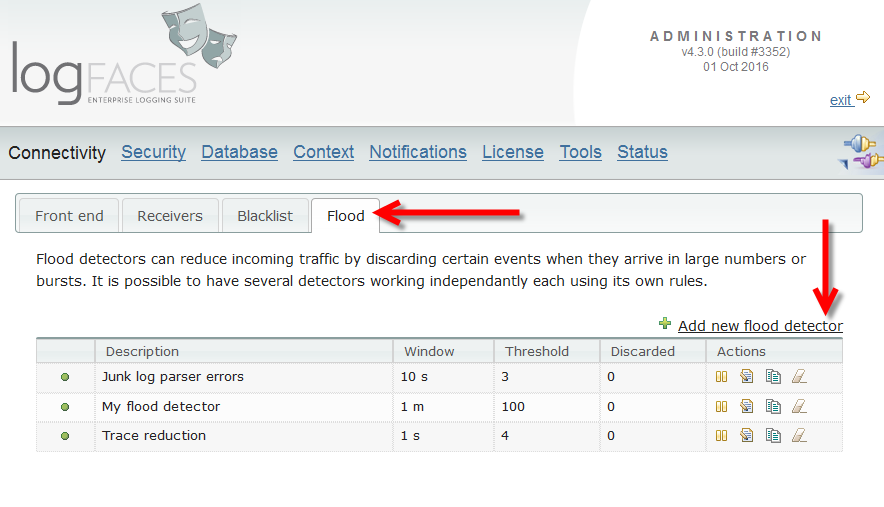
Next new feature is Flood Management. Often, applications produce too many repetitive log statements. Sometimes it's good, sometimes not. Enter flood detectors and decide what is flood, and how to reduce it.
Clients were upgraded to latest Eclipse 4.6 runtime so that we could continue with development before it gets outdated in this fast moving world. There are several visual and performance improvements, but mostly this upgrade is for compatibilty. Client installer now comes with its own bundled JRE if none is available. Clients should work better on Mac OS; this update corrects Java compatibility problem we had in the past.
See the release notes and the upgrade instructions.
We are happy to announce the release of logFaces v4.2.4. This is a maintenance update with improvements and fixes. Please check out the release notes. There are no special upgrade instructions but checkout the general guides for updating.
Noteworthy points for this release:
- We are starting to get logFaces into node.js these days, and as an initial effort we contributed a UDP appender to log4js-node project. There is a pull request pending, hopefully it will become part of their distribution soon.
- There were several complaints and confusions about triggers. We modified this mechanism to allow fast reaction without any time windows. So, if 'time window' and 'frequency limit' is set to zero, the trigger will react instantly.
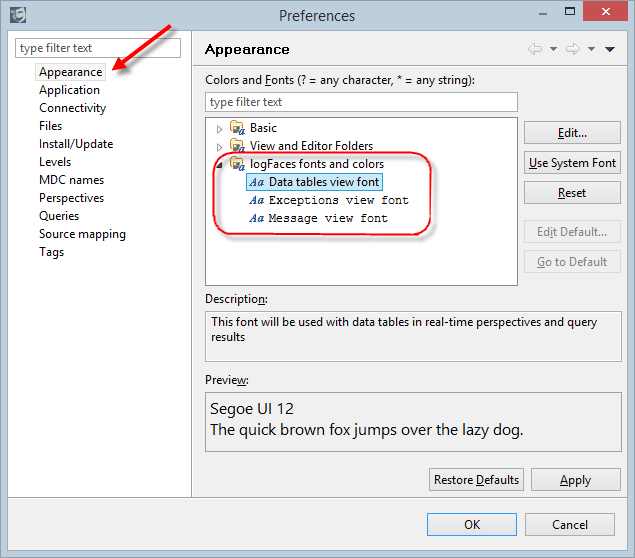
- Changing fonts in client views is improved by allowing Ctrl-Num+/- keys to increase or decrease the fonts without going into preferences.
- There are few other improvements in clients to make our lives easier. If you have ideas on how to improve user experience - tells us about it!
- Docker™ containers. Asked by many.., so logFaces gets "dockerized" and can be deployed and run with this cool technology. This attempt is experimental, I am not sure where will it take us in the future, this stuff changes rapidly and gets more and more popular. There are two ways to go from here. The simplest is to pull the public image from the hub into your local repository and use it. Or build your own images to blend into your working environment. We now have special distribution of logFaces server to be used with Dockerfiles. More on this is written in user manual.
- Support for MongoDB 3.2, recently released new storage engine and some security related additions. Java drivers are updated to the latest and tested. Starting from this update it is now possible to encrypt the transport between MongoDB and logFaces server with SSL/TLS.
- General improvements and bug fixes, some are quite annoying, make sure to upgrade soon.
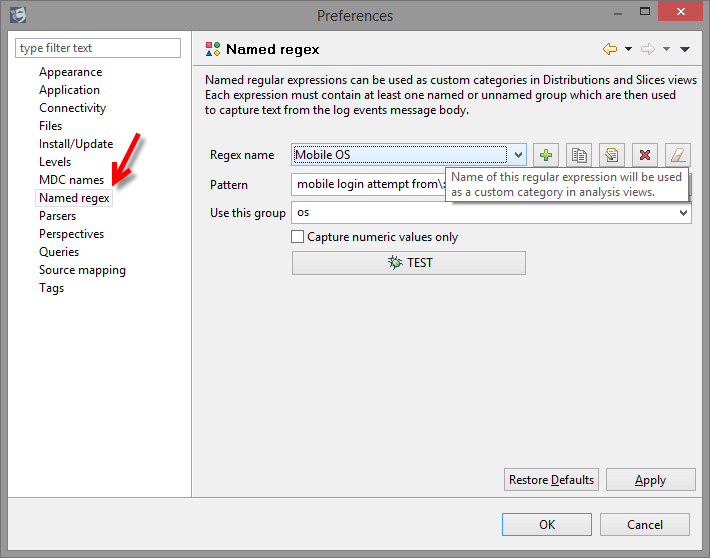
- Named regular expressions. This new tooling extends the existing analysis categories by allowing you to create your own slices of data. We will be relying on this new feature in our upcoming additions this year.
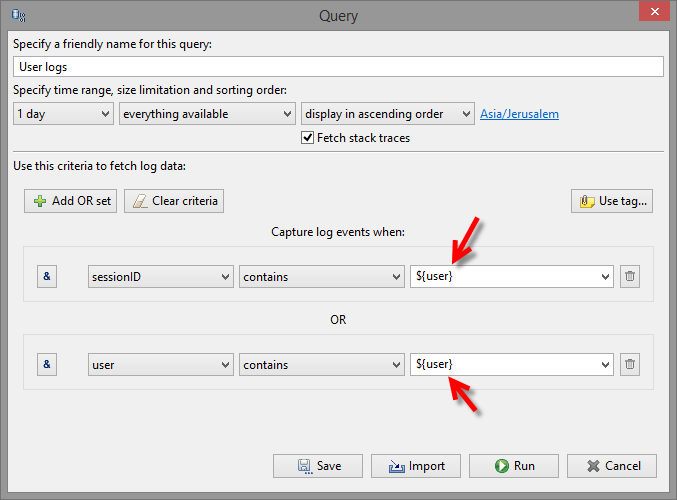
- Queries (and perspectives) with parameters. If you often do queries which require different values, then you will find this very useful. Whenever such query is started, you will be prompted to input a value. This will save time and effort.
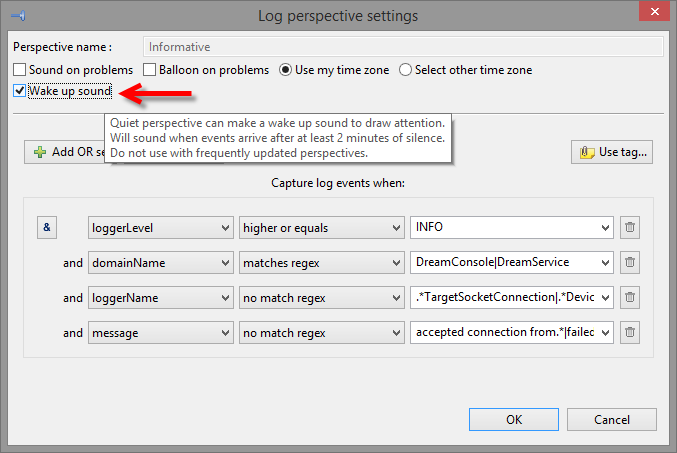
- Wake up sounds. This small addition works as an audible reminder that something has changed in your logs. It should be a useful addition to those who often use monitoring.
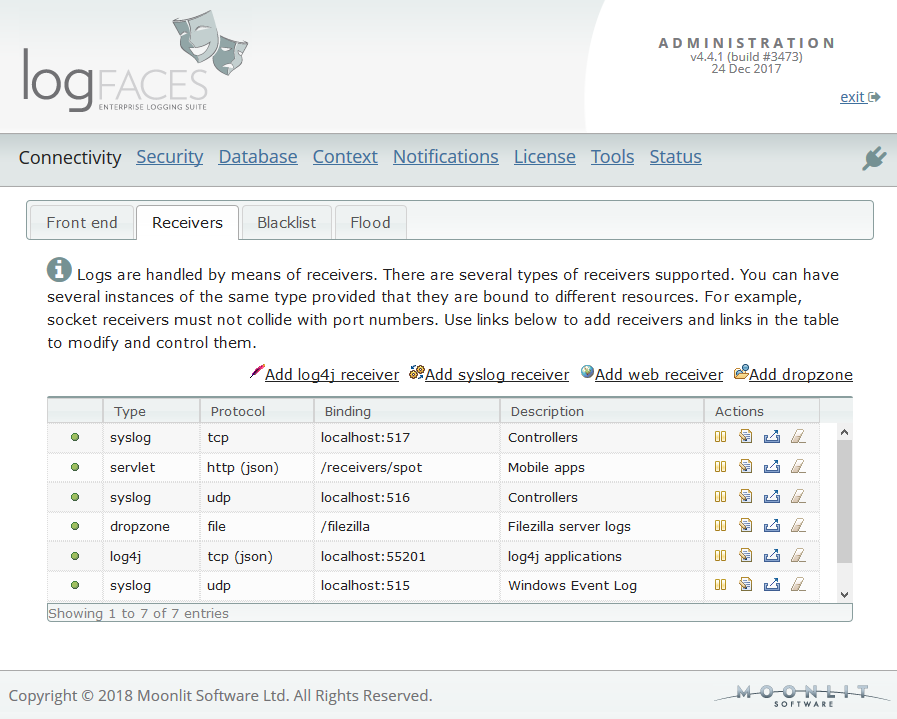
- Along with additional receivers (syslog and drop zones), we have extended the whole concept of data inflow. Multiple instances of receivers of the same type are now allowed, each instance can be controlled, managed and tested through the admin. There are several new options to control receiver's behaviour.
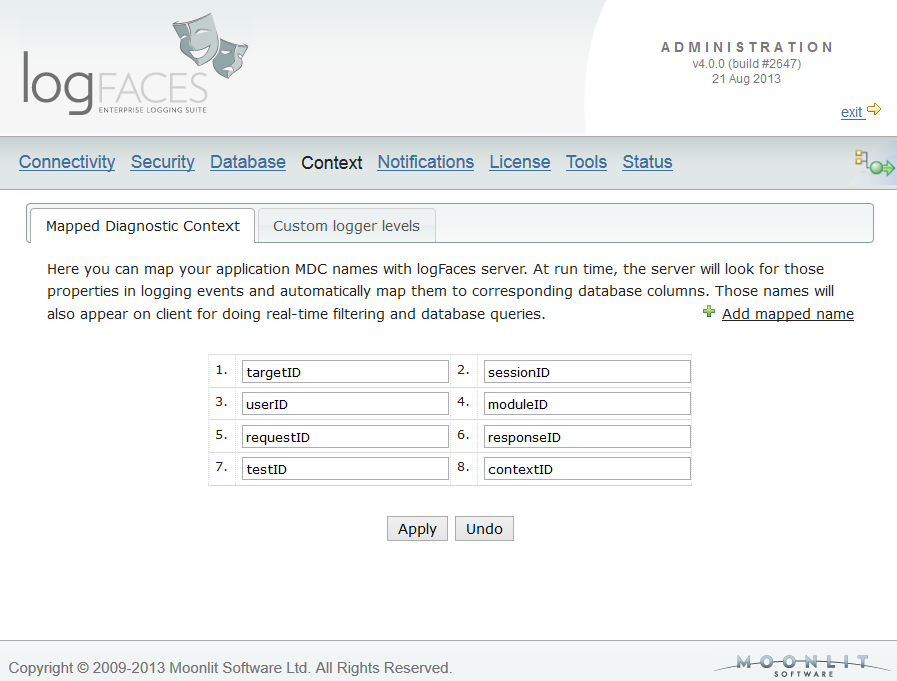
- Limitation on number of MDC names is removed for the systems working with MongoDB - use as many as you need! With relation databases things are a bit less democratic, but we have extended the schema to 10 names.
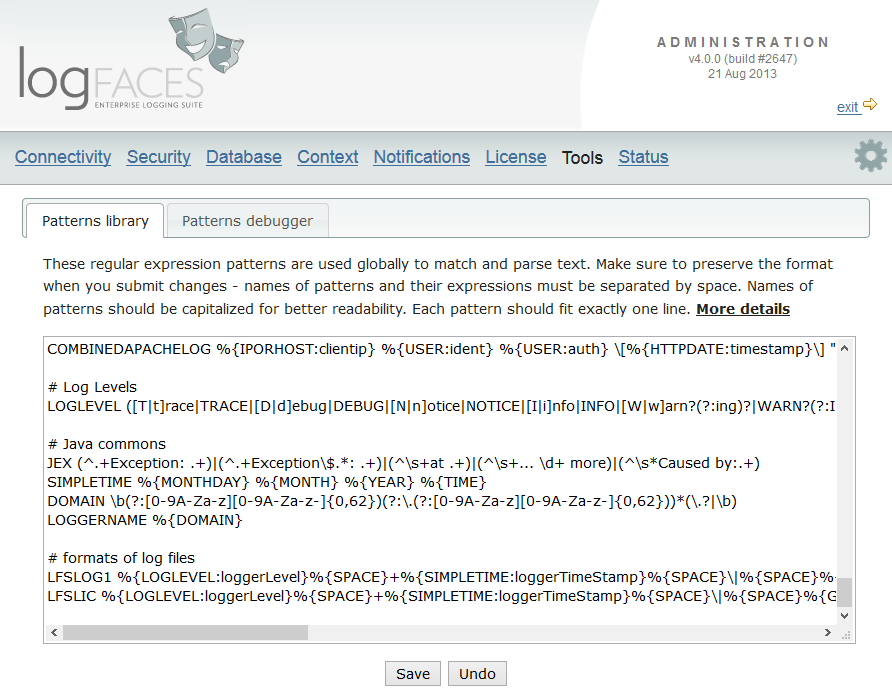
- There is a whole bunch of new things related to regular expressions - patterns library, drop zones (importing files), parsing and viewing of log files in clients.
- Admin interface is greatly improved and extended, some pages were completely replaced. You will find lots of help content on all parameters and test links for important operations.
- Clients get look and feel customizations, some serious performance improvements, new tools to parse log files, and all sorts of small cosmetic touches.
- It is now possible to use customized _id generation with MongoDB. The user manual is updated with details for the implementor (see 'Advanced setup').
- Creation of PK's with relational databases is also exposed for custom implementations. The user manual is updated with details for the implementor (see 'Advanced setup').
- We have removed management of MongoDB indexes from admin interface. It proved to be confusing, especially in the context of default indexes we gave during installation. In most cases users will need to pick their own compound indexes and compromise between cost of memory resources and keeping clients happy with decent query speeds. There are some explanations in details in user manual.
- Clients now have customized query option for daily spread distributions and some improvements to drill down options.
-
Syslog - a brand new face in town. We integrated a fully featured syslog server
into logFaces.
Although syslog is a completely different logging system to what we used to,
there will be almost zero impact for the end user.
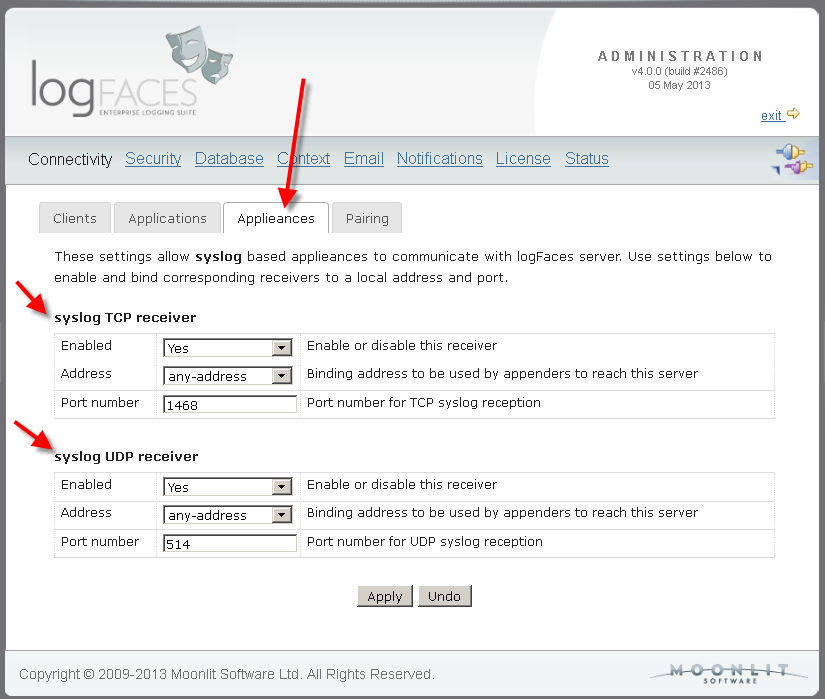
All you have to do is to enable the receivers in admin, direct your syslog sources
to our ports and the logs will propagate as usual.
It supports structured syslog formats, so if your app will transmit the application name and process ID,
this information will be available in clients. Otherwise, plain vanilla syslog messages
will be found under domain named 'appliances' with all the facilities applicable.
On clients you will be able to do everything in the same way - queries, filters, monitoring, etc.
Syslog brings with it another nice perk - the Windows Event Log can be easily forwarded by means of syslog bridges which are in plenty around. We tried eventlog-to-syslog and it worked like a charm. It actually means that you can hook all your Windows machines and stream the events to logFaces for real-time monitoring or permanent storage.
- Amount of MDC mappings is doubled. We have received many requests regarding this limitation. So now there are 10 names which can be mapped. Unfortunately this will require schema upgrade in relational databases, but it should be trivial to add several columns. MongoDB users are not affected for obvious reasons.
- Basic HTTP authentication in admin was replaced with proper login. If you are using LDAP for authentication, you may want to delegate this process to your own directory. If you don't, the password is still kept obfuscated on local disk.
-
It is now possible to use MongoDB TTL collections
introduced with MongoDB v2.2.
TTL collections are great for storing log data because management of storage
gets automated by database which simplifies things tremendously and makes it more efficient.
We had to convert the 'time' column in schema from 'long' to 'Date' in order to be able to utilize the TTL index. If you want to use TTL with your existing database, here you will the instructions on how to convert the schema.
If you don't need the TTL, this change is transparent for you, nothing needs to be done, it is still safe to update, the schema is backward compatible.
- Client has some minor updates in regards to combo boxes in criteria filters. We have added "auto-complete" so that when there is a huge list of options to chose from, you will be prompted to choose one while typing. Also, there was a glitch on some Linux distributions with displaying SWT combo boxes, fixed as well.
- Java appenders are improved as to ensure that the internal queue gets flushed to the server when appender shuts down. Not having this would have resulted in data loss if application rapidly goes down while appender holds some of the log statements in its transmitting queue. Now we ensure that the queue is transmitted to the server before yielding control to the calling thread trying to close the appender.
- We have completely redesigned the way you make queries in client. Now all queries are based on criteria filters, just like those in real-time perspectives, this brings more capabilities and are more consistent with overall design. Your existing queries are automatically converted to a new format.
- There is a new form of query - "Fast Fetch". This is to avoid defining and saving all parameters, but gets right into the data. Now if you want to get something out of the database real quick, you don't have define all the stuff - just select filters and hit a button to get the data.
- There are lots of new context menus throughout the data tables and views to allow instant creation of queries and perspectives. It is now possible to "follow" particular events by simply pointing to those which are already in the data tables. If you see something of interest you can now "fetch identical" events in certain time ranges. Message and Exception views now have context menus as well to allow fast access to perspectives and historical data. Clipboard copies are improved, it is now possible to copy content of individual columns in addition to formatted and value-paired lists.
- All views now have a gentle touch of colour, some with the context of the data it shows. It looks a bit happier now.
- Server admins can now easily clone existing reports and triggers. Very handy.
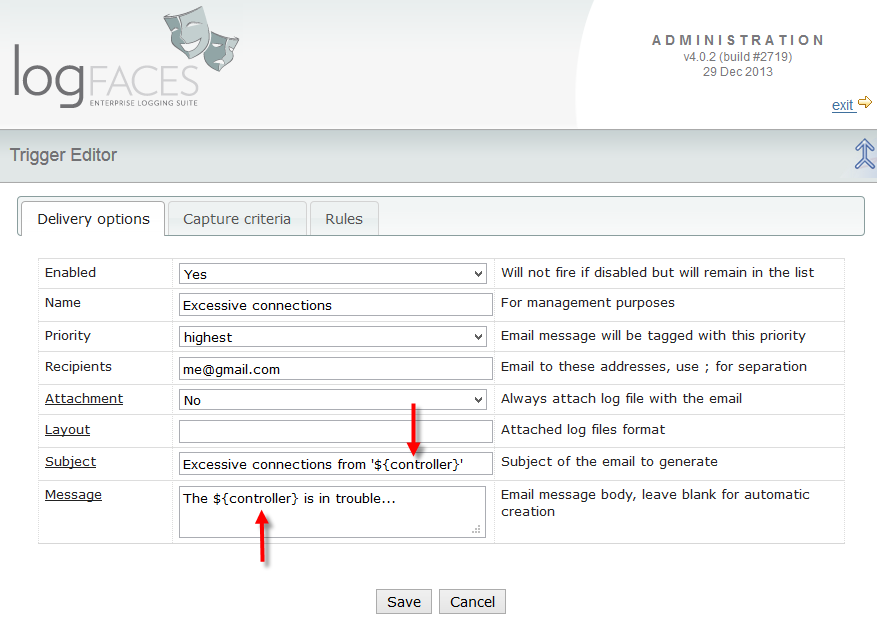
- Email subjects can now be customized with ${var} notation to create a more descriptive subjects. So if you use notifications a lot you should find this useful.
- Sometimes the TCP receiver would unexpectedly shutdown and render server unavailable to appenders until restarted. The problem is likely related to underlying network infrastructure or leak of resources (file handles); we made sure that receiver never shuts down and tries to accept connection hoping that problem would go away eventually. We have also added detailed exception dumps to know what is the cause.
- Appenders needed to escape some more illegal characters, this caused some log events go into the cosmos. It probably happened when binary data was logged.
- Somehow the latest API got broken in previous release, an embarrassing glitch, now fixed.
- The database backup script fixed, wasn't working as expected.
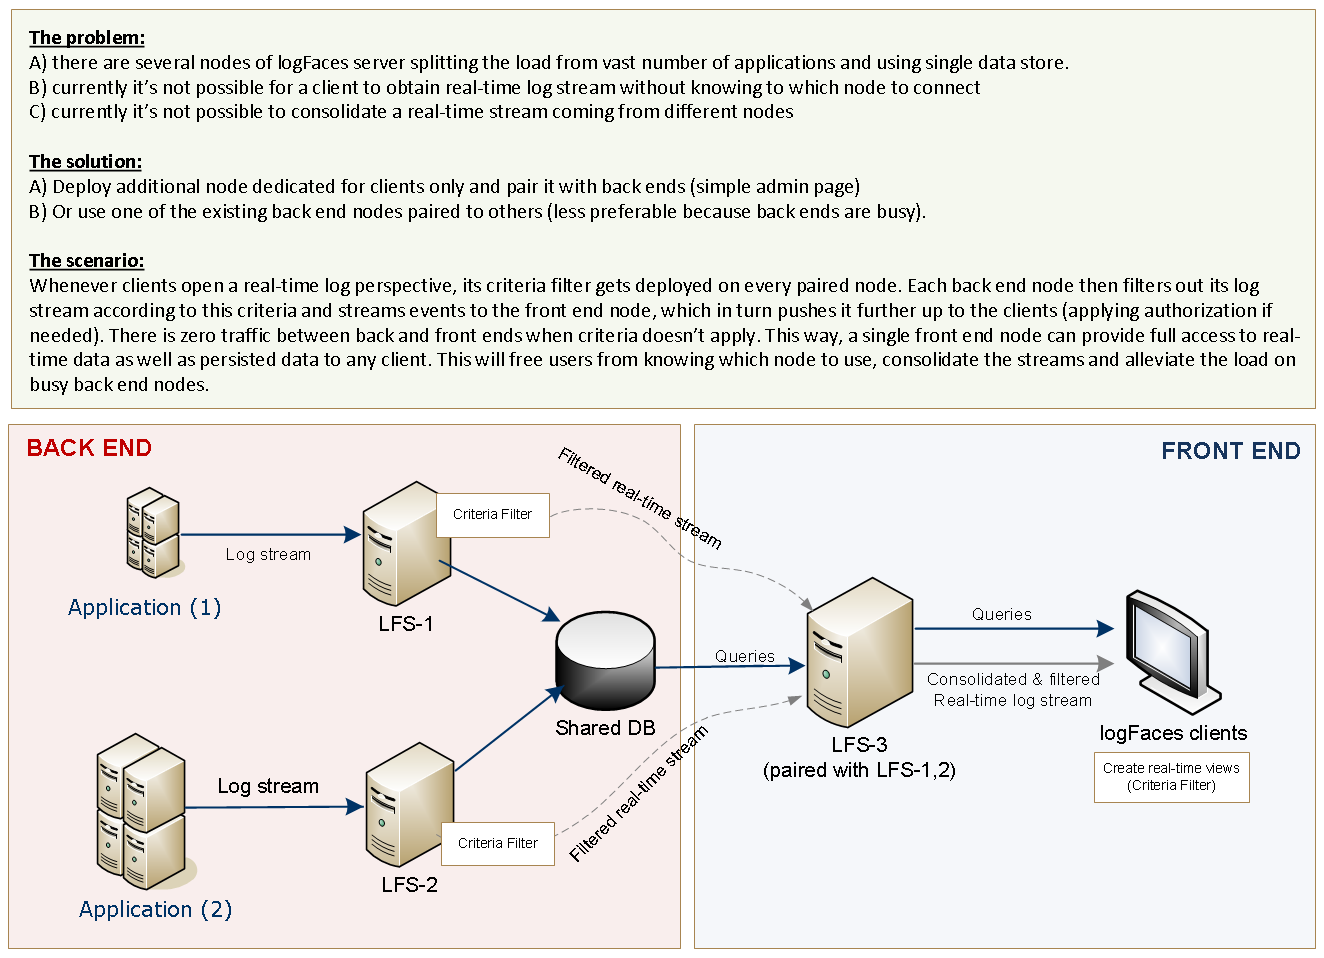
- Pairing. Up until now multiple logFaces nodes could share single database, but getting the real-time stream required switching between nodes, which is not so cool. Pairing introduces single point of access to all clients and will consolidate everything through one single node we call front end. See this diagram for more details.. Why would you want to have several nodes in the first place? Two obvious reasons - a) to split the load; b) to provide fail-over. If these are important to you, then you should find pairing very useful.
- Binding. Now it's possible to bind external and internal sockets to a particular address. This is useful when computer has several network cards and you want to do physical separation of the networks by binding clients and appenders to different interfaces.
- SSL. We have finally added SSL transport for client connections. This is particularly useful when accessing the server from outside of the organization. Please note that we don't allow self signed certificates, so in order to enable the SSL you will need to obtain or use existing SSL certificate issued by proper trusted CA. There are instructions in user manual how to enable server for the SSL transport.
- Ajax. Admin console is improved with background Ajax calls in order to prevent annoying page flickering. But the most important is that status page can now be seen with real-time updates without refreshing the content.
- Starting from this release, the server gets equipped with auto-updates mechanism. No more manual downloads and installations. Just go to admin/status page and check for the updates. Once available, the server will download the update pack, install it and restart itself. Magic.
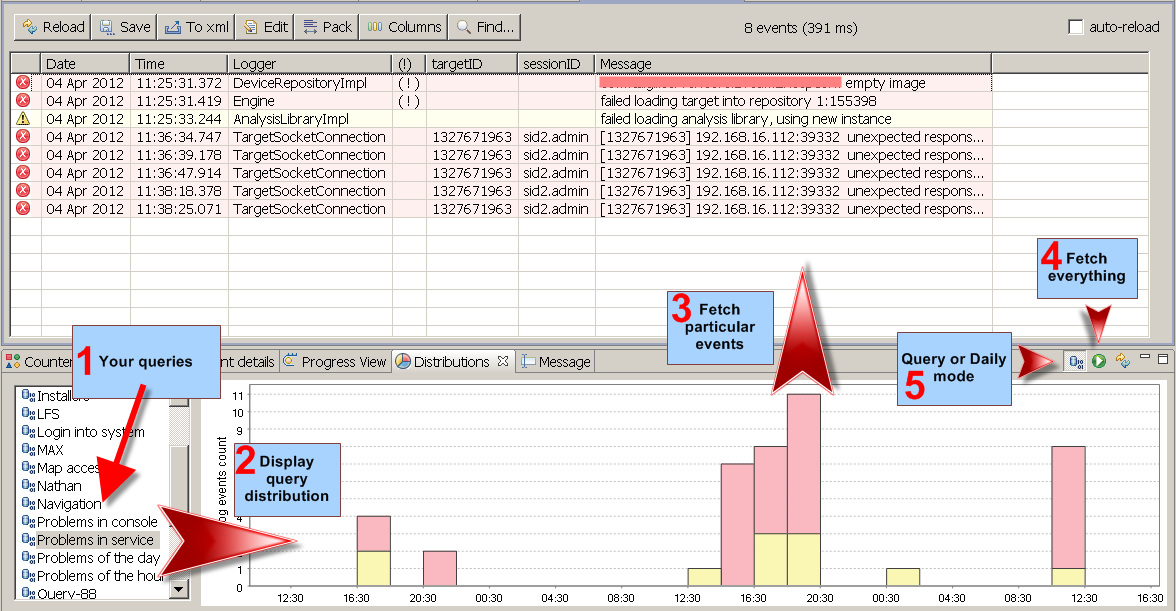
- Clients get new little feature - query distributions. Just like displaying daily distributions, it is now possible to display distribution of the queries before actually fetching all the data. Click here to see how it works. If you used daily distributions before and found it useful, the distributions of queries will nicely complement that.
- Windows installers fixed to work with Java7
- LDAP mapping extended to cover wider filter of user and group classes
- We had a bumpy upgrade for those of you using MongoDB, so here comes the correction. We did something not very clever by trying to manage the indexes automatically. Not always it's the best choice, so now you've got an option in admin page to opt out the automatic management of indexes. This is particularly useful if you must use compound indexes which sometimes perform better than singe attribute indexes. Note that by default this option is now disabled, make sure you set it up as required after the upgrade.
- Since we added several new properties for MongoDB integration some of them didn't get converted properly which resulted in some exceptions through the administration console. Now fixed forever.
- We have received several recommendations from 10gen (the developers behind MongoDB). First - the driver (2.7.2) we included in the distribution appears to be problematic performance-wise, so it must be upgraded to the latest (2.7.3). After upgrade make sure that it's in /lib/dbdrivers folder and it's the only driver. Second, we've added another option to enforces periodic getLastError call on database connection, it's believed to improve the throughput on a very heavy loads.
- Several annoying bugs in client related to displaying very long names, MDC queries and inner class separators.
- Appenders had a bug creating malformed XML caused by some control characters which had to be escaped.
- Database connection recovery wasn't working properly in certain cases.
- When server restarted with database being offline we would sometimes miss filter settings and forget to save them.
- Shared workspaces credentials shouldn't be persisted so that when workspace is imported, users could use their own credentials. This fix is only relevant when working with security enabled on server.
- Hosts view didn't always update with client running in server mode.
- Clients in server mode somehow got broken in previous release. Get it now if you use server mode.
- MongoDB related. Now it's possible to use replica sets for redundancy and fail-over. We've run some quite extensive tests with it, and I must say it's quite an impressive feature. We have also improved the way capped collections can be used by automatically converting to it. There are several new properties added to configuration in this respect, you will find it explained in user manual. Also, there were several nasty bugs related to indexes.
- MySQL queries will now work with streaming, I wish I knew about this hidden feature earlier. We did all sorts of tricks around the lack of server cursors in MySQL. Not anymore. Streaming significantly improves many queries, particularly those with large data sets.
- Connecting to LDAP over SSL is now possible, you will find a new parameter in admin security page. If you will be authenticating with a well known root CA, there won't be a need to do anything. Otherwise the trust store with that certificate will have to be let known to logFaces server JVM. Self signed certificates can be used, but they will have to be registered.
- Server filters (database and triggers) are now capable of trapping (or ignoring) particular exception classes, not just a thrown indication.
- Lots of improvements in admin status page, particularly the overload indication. When database becomes a bottleneck, logFaces server goes into a special mode of overflowing the inflow into the local storage. This is often a performance killer. So we have added an indication on status page which will show you if your server is being overloaded (over-fed) with input logs. If you will see red colour with a flag - it will be the sure sign for checking your setup.
- Clients can now share workspaces on server and import them from server for better team collaboration. Setting up logFaces client with lots of filters, queries, components, could be a tedious task, and it's best if only one person does it once and then shares with others.
- Clients now have a new view - Hosts. This is yet another convenient jump point into the log data. It displays all hosts ever logged to logFaces. You will be able to query their logs with just a click of a mouse.
- Distribution for Solaris x86-64 is now available
- Windows 64bit OS's are now welcome to run our server, our new Wrapper license shines!
- logFaces can now work with MongoDB, it proves to be stable, RAM thirsty (as expected) but works wonders with fairly large volumes of data. Before we didn't see numbers like 100 million records (in logFaces context), but with MongoDB it becomes reality.
- We now support NLog - popular logging platform in .NET universe. There are two reasons we went into this - 1) it has both TCP and UDP asynchronous appenders which work seamlessly with logFaces and 2) log4net seems to be in hibernation for almost 5 years and .Net users are desperately looking for alternatives.
- Server authorization rules can now work with wildcards.
- Many improvements in administration pages.
- It is now possible to do client queries for particular Exception classes, not just anything thrown.
- Added periodically auto-reloaded queries.
- Better integration with external editors for displaying source code. Using ${file} and ${line} placeholder you can now launch your favourite IDE right from the logFaces view.
- In addition to sound alerts it's now possible to display tray-like balloons with nice alert message.
- Improved 'Details View' will now display all event properties, not just those mapped to MDC.
- It appeared that MongoDB has specific way of managing disk space and releasing it back to the OS. Since we do fairly massive deletes when database starts rolling, there is a risk of running out of a disk space. We did most of the tests with MongoDB v1.6.4 and it does look like the disk space is sometimes not re-used properly. Latest version (1.8.1) doesn't seem to have this problem, but to avoid such situation entirely we added a scheduled job to compact the space explicitly. You can now specify a cron expression to do this periodically. Another option is to run your own scripts to do the same. The only catch is that this operation is slow and costly, so it should be run off rush hours. But it's better to be slow sometimes than risk the machine failure.
- This maintenance job will do two actions - compact the space and rebuild the indexes. Both actions are optional and can be substituted by external script.
- Admin status page now has more details.
- Several minor bug fixes in client and server.
- Java Service Wrapper - our bootstrapping tool, now comes with a commercial license, which we acquired to support more platforms, particularly Windows 64 bit systems.
- MongoDB is now fully integrated and looks promising. Although it looks stable, I would still consider this an experimental feature as we don't have any production experience with this tool yet. How does it work in real life? We are really looking forward to hear from you. The updated user manual has instructions for settings it up - it's extremely simple.
- Improved authorization rules, it is now possible to use wildcards to map users to the server content.
- Extended queries based on exception classes, you will now be able to fetch not just thrown log statement but precisely which exceptions you'd like to see, for example java.lang.NullPointerException, etc.
- Client gets a lift; added auto-reloading query results, query duplication, launching external editors with parameters so that you could use your IDE to open the source code from logFaces. And many minor cosmetic fixes.
We are happy to announce the release of logFaces v4.2.3.
This is a scheduled maintenance update correcting bugs reported to the date and improving several pending items. We get better with every update! Please check out the release notes. There are no special upgrade instructions but checkout the general guides for updating.
Happy new year everyone! Best wishes for the new and shiny 2016!
logFaces continues with just released v4.2.2 maintenance update.
Stay up to date with the user manual. There are no special upgrade instructions, just go to admin/status page on your server and let it do the rest. Clients are updated from their Help menu as usual.
This release comes with significant improvements to server performance. We did extensive profiling and improved server throughput where it comes to large volumes of data to process. That was a massive re-factoring of fairly old bits of code, this is why this update took longer than usual.
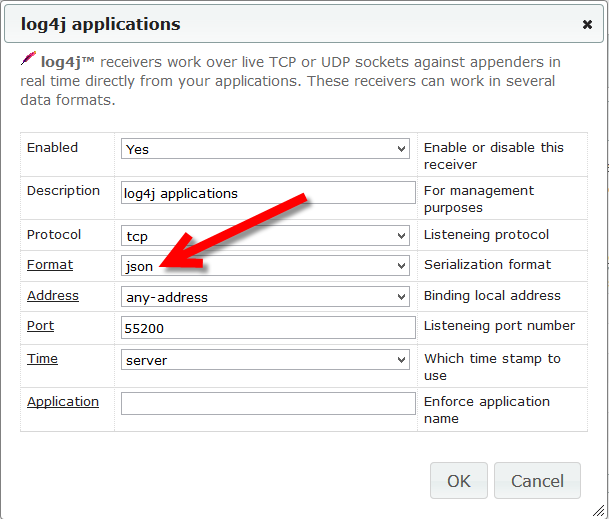
In addition, there is a new set of appenders to give us even better utilization of resources. Starting from this release, our Java appenders can be configured to use JSON format instead of XML. This format significantly reduces network payload and makes server side parsing much cheaper in terms of memory and CPU. Existing XML appender (and receivers). will continue to work as usual. To switch to JSON format all you have to do is to add a "format" attribute to appender configuration. More details are in user manual.
Another notable item in this release is a support for MongoDB v3+. This involved updates of the Java drivers and massive compatibility tests. Current update will work with both MongoDB v2 and v3.
More additions, improvements and fixes can be found in release notes here. There are no special upgrade instructions. Keep current and let us know what you think.
We are happy to announce the release of logFaces v4.2.
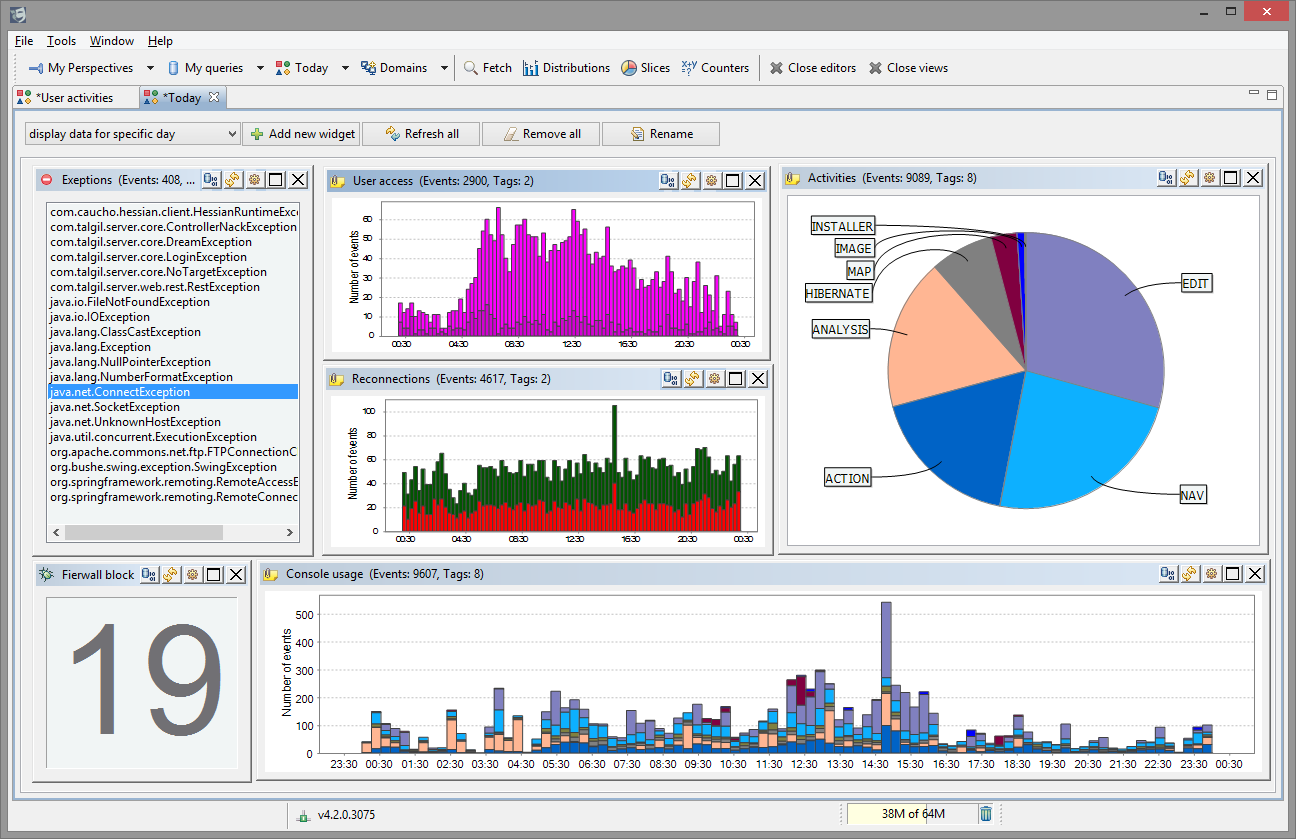
Minor version increments always indicate some new faces, and today we introduce the one called Dashboards. It extends our existing analytical tools by letting you build your own dashboards to slice and dice your logs into interactive charts.
This 55 second presentation should be better than words and manuals, just make sure to turn up the HD because YouTube by default renders everything in a worst possible resolution.
Being the hit of this release, dashboards are not the only thing coming out this summer. There are other additions, improvements and fixes based on your feedback and requests. Please check out the release notes.
There are no special upgrade instructions. Keep current and let us know what you think.
Spring is in the air! And we are happy to bring up this maintenance update to you. This update is mostly about logFaces clients, there are some face lifts, improvements and minor bug fixes. Please check out the release notes. There are no special upgrade instructions.
This is, hopefully, our last update in v4.1 series. The next release, due this summer, will bring us a brand new face to look upon. Something fresh. Stay tuned!
Happy new year everyone! We wish you the best for the 2015!
logFaces continues. Just released 4.1.3 with improvements and fixes. Note that there are some API corrections and updates in log4j2 appenders, if you are dependent on them, make sure to grab the latest.
The most notable additions:
Stay up to date with the user manual. There are no special upgrade instructions, just go to admin/status page on your server and let it do the rest. Clients are updated from their Help menu as usual.
This is rather unscheduled update due to some glitches, we needed to kill them as soon as possible. Please check out the release notes.
There are no special upgrade instructions, just go to admin/status page and let it upgrade.
It was a hot summer this one...
Here comes our regular maintenance update for the current version. There was an unusual amount of bugs covered this time - special thanks to everyone reported!
Some of the issues were quite serious in some circumstances, so it is highly recommended to upgrade. There are also some nice improvements and additions. Detailed release notes are here.
There are no special upgrade instructions. We get better with every build. Stay current!
We are happy to announce the release of logFaces 4.1
If you use MongoDB, then this release is definitely for you. We believe that this is one of the best releases logFaces have seen since we started to support MongoDB storage.
It's about storage size and performance.
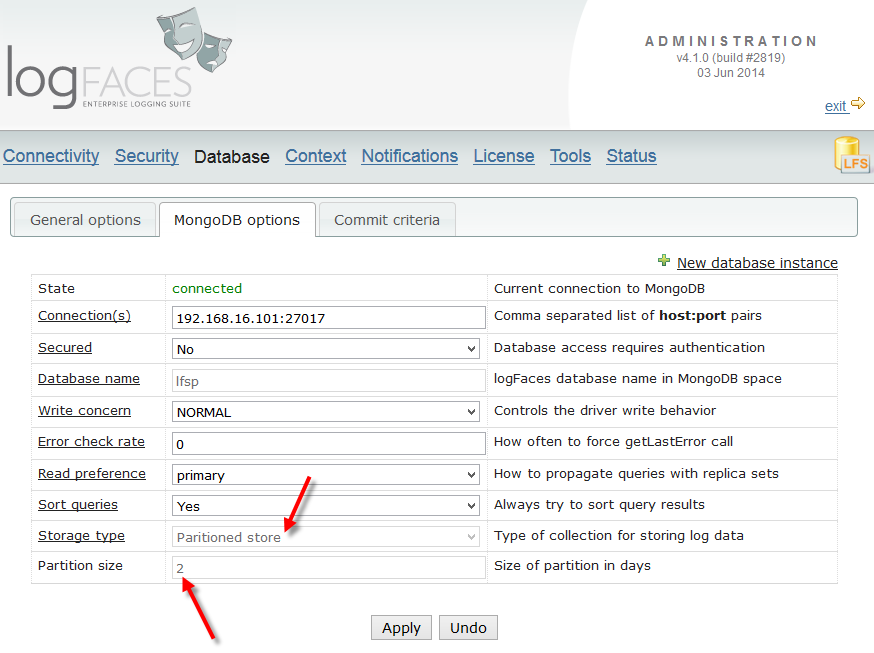
There is a common problem with data storage of most kinds - it's much easier to store things than to retrieve them, and quite difficult to delete them. The problem intensifies as storage grows. To address this problem we introduce an alternative way for storing very large amounts of log data. Instead of using a single collection which is our default setup, you can now choose to split your entire data set by days, or as we call them - partitions. Not only it improves the overall performance, it also allows us now to store very large volumes of data and move them around quite easily.
For example, if you store few millions of log events per day and your database fills up and starts rolling by removing older data, this removing gets quite costly in terms of resources and will affect the overall database throughput. The bigger that single collection grows the worse things get. What we learned is that dropping an entire mongodb database is quite cheap and almost unnoticeable. In fact it's the cheapest way to get rid of old data. Second cheapest way is to drop a collection, but dropping the database simply rocks. Plus, there is a huge boost to the queries because most of them will run on much smaller collections.
Partitions work quite differently from regular storage - I encourage you to read about them in user manual.
Along with partitions, there are some small improvements and bug fixes. Quite some bugs actually, see the release notes. There are no special upgrade instructions, everything is automated.
Apache log4j™ team does a great job by moving the project to a major update. We are also looking forward for it to be released very soon and developed corresponding logFaces appender to go along.
Because incoming version 2.x is significantly different from its predecessor, we have added a brand new appender on our side. Functionally it's the same - it is asynchronous and carries on the same fail-over mechanisms. New appender has absolutely no affect on existing log4j 1.x appenders we have. It resides in the same jar but in a different package. You will use either current or new generation of appenders in your app, but never a mix. Make sure use corresponding log4j v2.x dependencies as well.
The distribution jar can be found in downloads. Integration details can be found here in user manual Feel free to give it a try and let us know what you think.
Here is a maintenance update with several minor bug fixes. The release notes are here. There are no special upgrade instructions; for the server do it from admin/status page and for clients from its Help menu.
Just to keep you posted, we are soon to release a major improvement related to logFaces integration with MongoDB. We are changing the way it stores large amount of logs in hope to boost query performance and be able to store more data. Stay tuned!
Here comes our first maintenance update for v4. The release notes are here. There are no special upgrade instructions; for the server do it from admin/status page and for clients from Help menu. This update contains left overs from the major upgrade, some of the bugs are quite annoying, so it is highly recommended.
And as usual, each update we try to accompany with something new and this time is no different.
Introducing Split Triggers:
Just a reminder - logFaces triggers are real-time email notifiers based on some rules you specify. Those rules watch for occurrence of certain amount of events to take place within certain time frame. Triggers are great for alerting on some repetitive or offensive situations when things go out of norm. For example - burst of errors or stuff like that.
So far so good. But what is there to improve?
The answer is - the context!
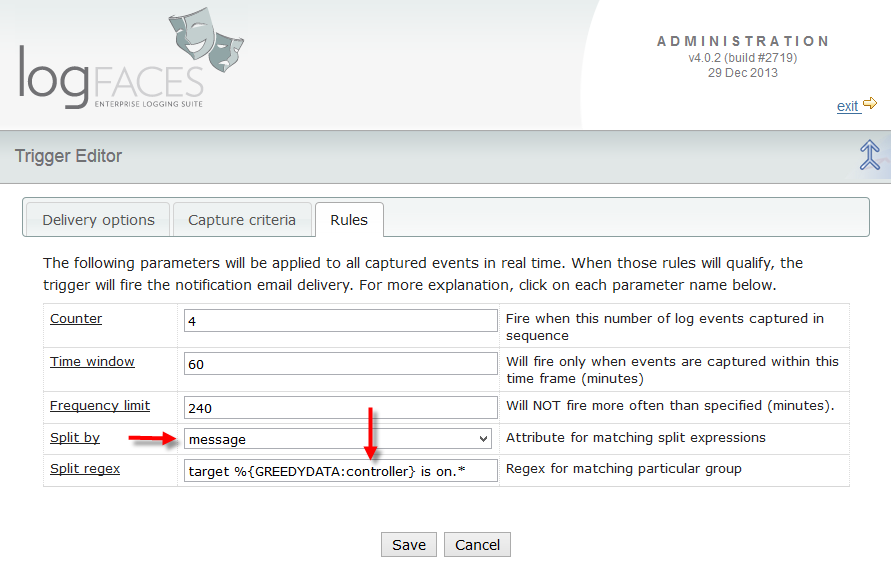
Triggers will now be able to react not just to the amount of events registered, but also to the
context
of those events which can be anything from the event itself, like host name, MDC property, or part of its message.
This way the same trigger becomes split by the context and will apply the same rule to each context variable.
Context (or split) variables can also be used in email subject and body to indicate in which context the trigger was fired. More details can be found here in user manual, I hope you will find this feature useful!
We are happy to announce the release of logFaces 4! After several months in beta testing it looks like we are stable and it's time to move on. The upgrade is fully automated and will work seamlessly, the upgrade instructions are here.
Make sure to take updated user manual, some of the sections were completely re-written to reflect the extensions brought up in this release.
So, why major version increment?
There are several new features which are conceptually new to the idea behind logFaces. For example, we've never thought of handling syslog sources, or processing raw log files offline. Also, we didn't realize the importance and usefulness of MDC when we designed the server. These items are the primary contributors to v4, but not the only ones. There are many smaller additions, improvements and bug fixes, see the release notes for more details.
To briefly summarize this release:
Enjoy! As usual, looking forward to hear your feedback.
Hopefully this is the last maintenance update for v3 as we are moving into v4 in a couple of months. This update is mostly about bug fixes, full release notes are here. Upgrade instructions can be located here.
More update in regards to upcoming v4. The official release is due in September-October. For now, the development is over, it's almost mature to go live. Last touches included performance improvement on client side and client-server communications. The beta is still here, it's very stable now and you're most welcome to try and give us your feedback.
This is the third maintenance update for v3.2. The release notes are here. There are no special upgrade instructions, for the server do it from admin/status page and for clients from Help menu.
Along with minor bug fixes there are several additions and corrections worth noting:
-
Short update in regards to upcoming v4.
Added recently the capability to import and index raw text files in any format.
There is some regular expressions wizardry added to admin and we will also let clients
parse any textual logs to utilize existing visual tools.
All this shall give us some means to work with offline and legacy systems.
The beta is here.
It's relatively stable and you're most welcome to experiment and give us your feedback.
We are happy to announce first public beta for v4. Release is planned for the second half of this year. There are no special installation instructions except that clients v3 are not fully compatible with server v4 and vice versa. Current stable v3 will continue as usual until eventually replaced by v4.
So, what have we got to offer and why there is a major version increment?
There is an urgent fix in logback appender. If you are using logback as your logging framework, make sure to take the new jar and replace it in your apps. The problem was related to a wrong thread name emitted from appender and incorrect MDC values.
Today we post the second maintenance update for v3.2. It contains primarily bug fixes, minor improvements and left overs from the previous updates. Some of the bugs are quite annoying, so if you stumbled upon some of them, don't hesitate to get the update. There are no special notes for the upgrade, for the server do it from admin/status page and for clients from Help menu. The release notes are here.
We finally release v3.2, it looks stable and ready to roll. Along with new features described in the previous post, there are quite some bug fixes and improvements which you will find in release notes.
Although it's a version increment the upgrade should be fairly simple as long as you are using v3.1, the instructions are here.
We have also added a bunch of short video tips to cover some of the new features. This list will grow as we find more interesting tips to share with you.
Happy New Year everyone!
We start this year with a bunch of new stuff and looking forward for adding even more ideas during the year.
In v3.2, which will be our base line for the year, we are adding some significant improvements, but before it
goes live, we need to make sure it meets the user.
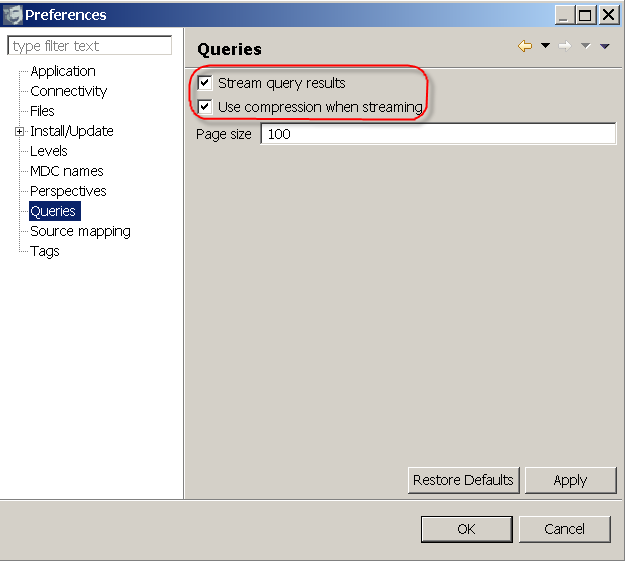
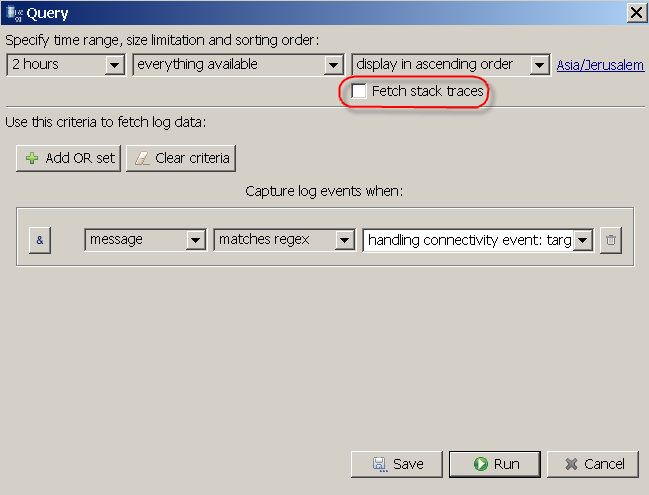
Streaming query results. If you ever used logFaces over the public internet or VPN, you might have noticed that large result sets are slow to get to the client even with a well tuned database. It may get particularly painful with huge queries containing exception dumps, which is often what people do. In this release we addressed this issue and managed to improve the speed by the magnitude, sometime more. The slower the client-server connection, the more vivid will be this improvement. Now, instead of paging the result sets and hitting the server on every page, we do streaming which takes a single server hit and delivers everything to the client in one shot. The stream may get compressed. Plus we bypass many conversions while streaming simple JSON text. Yet another plus is that we can now lazy load the exception dumps. All this makes a significant performance boost for far remote users.
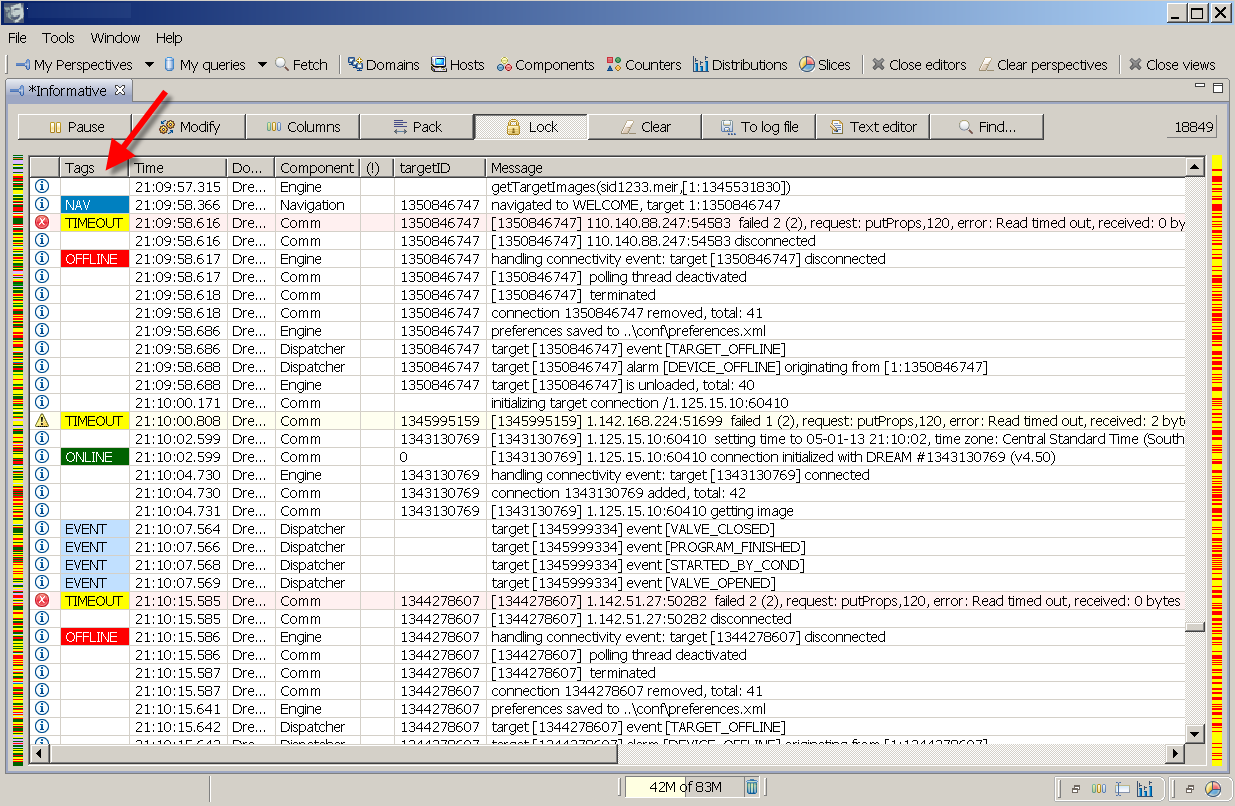
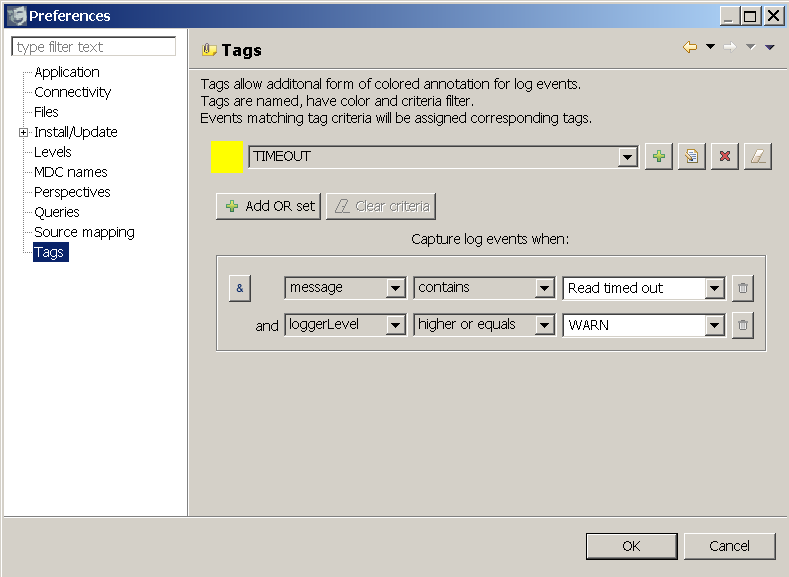
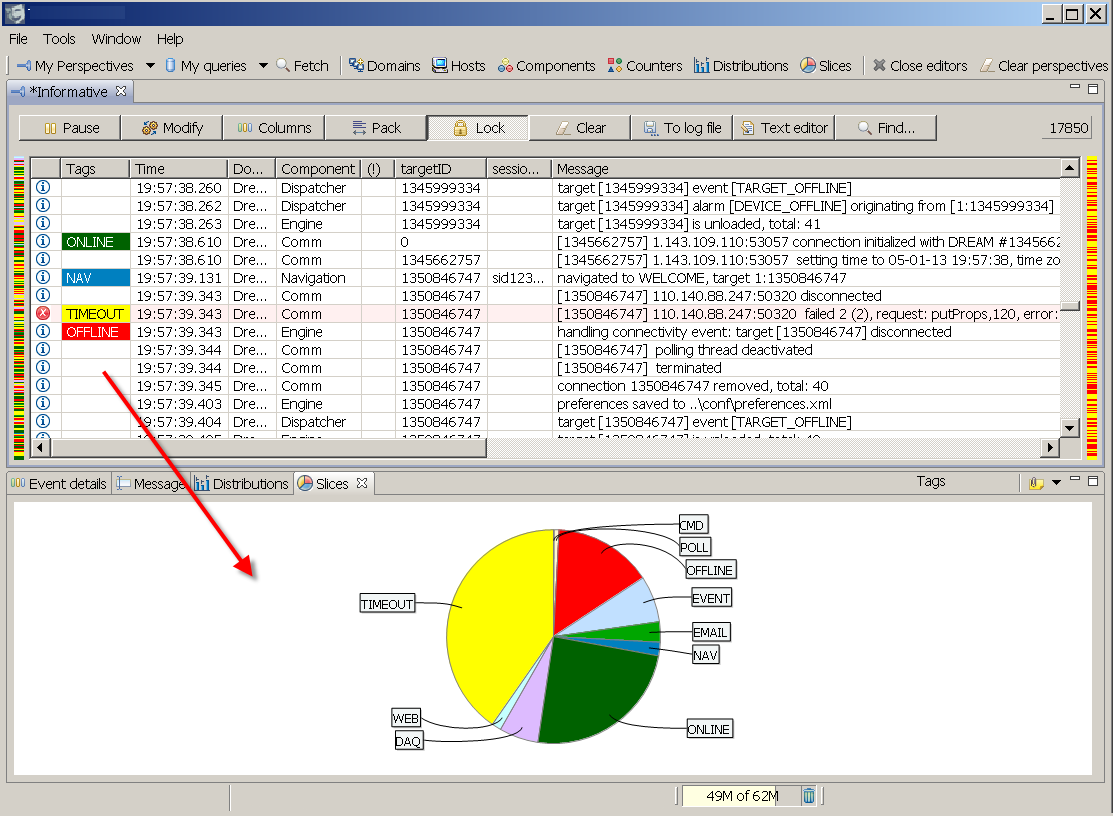
Tagging log events. This feature is so cool, I don't know why we didn't nail it earlier. Tags add domain specific indications to a dull technical log stream. You create a tag by giving it a short friendly name, colour and matching criteria. Logs matching the tag criteria get tagged before they get displayed. The criteria is the same bunch of rules we use in queries and filters, nothing new here. Tags are a very powerful analytical tool - they participate in all filters we already have plus the new tools we bring now - read on.Slicing log views by categories. This is a new face. When you look at a bunch of log statements, the Slices will give you a quantitative correlation picture. It answers a question 'how much of what stuff is in there?' and it will let you easily pin point the most representative offenders or contributors by category. Particularly interesting is the usage of tags.
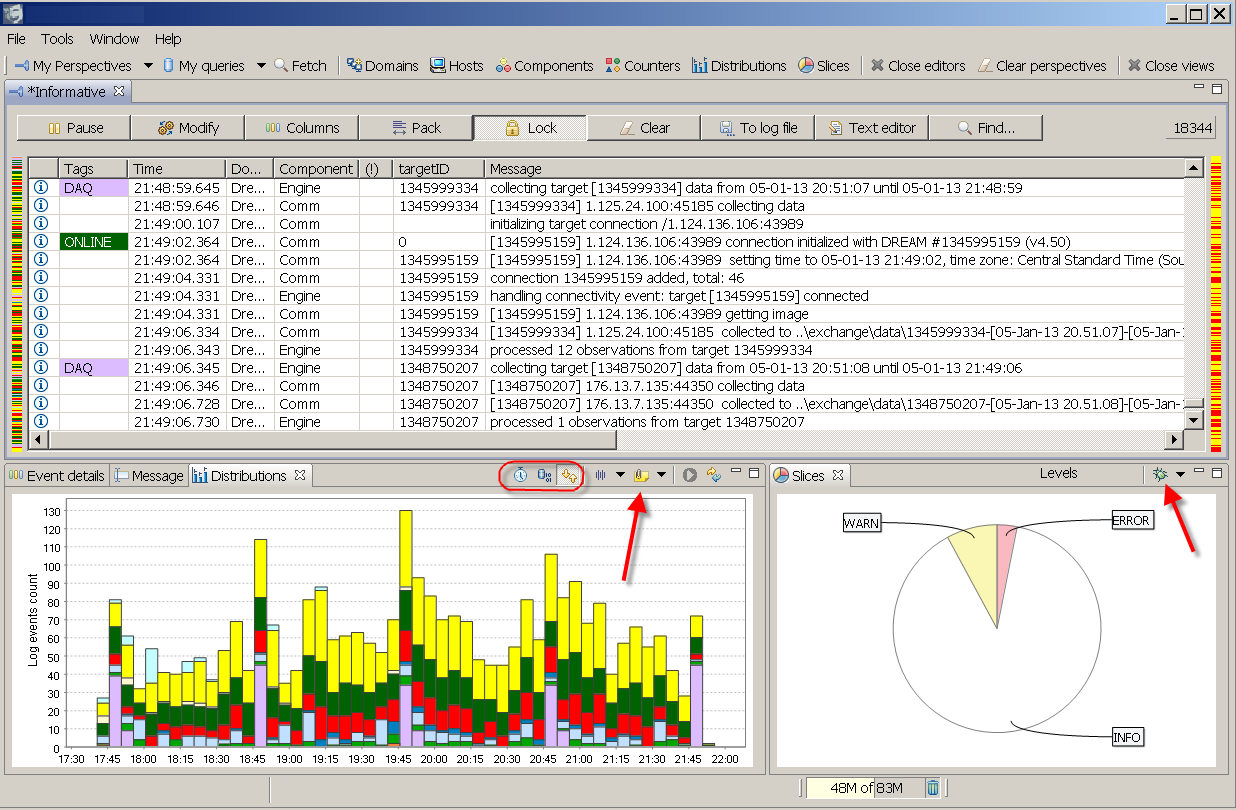
Spreading log views in time. We already have so called distributions where you can get a time line of log statements grouped by severity levels. Adding now is the capability to time line any active view by any category, including our beloved tags! This tool answers the question 'when have this happened and who are the contributors?'. Combining slices and time lines you will be able to find some interesting things in your data.
Somehow it slipped everyones attention that log4php™ has graduated from the Apache sandbox this year and is now officially listed as part of Apache Logging Services family. These are very good news and we gave it a try.
It works handsomely with logFaces, no adaptation is required, no special appenders, no special rules. Simple. Intuitive. Right to the point piece of software. All you need to do is to twitch its configuration and you are ready to face the logs from your php projects.
There is an out of the box socket appender which can be configured for either TCP or UDP transports. We have updated the user manual with configuration examples. Give it a try and let us know what you think.
We are happy to bring you a new update with many improvements. Being mostly about client user interface, this update has some important fixes we did on the server side also. Look into release notes for more details.
There are no special update notes, use server admin status page to download and install the update pack, and on client use "Help/Check for updates" menu to install new plugins.
Here is a brief summary of notable changes:
There is a new build available fixing some urgent problems detected in v3.1.3. All problems are on server side, to update go to admin status page and install the fixes. Here is the detailed list:
We were closed for the vacation in June while several issues got piled up and stay unresolved. Here you will find the detailed description and workarounds. Apologies for any inconvenience caused, the fixes will follow ASAP.
This update brings exciting networking features, important bug fixes and a bunch of improvements. See release notes for the details. So, what's new?
This is the second maintenance release for v3.1, feel free to download.
After quite some time in beta, we are finally releasing logFaces clients for MAC users. We have originally aimed to carbon based architecture but this appears to be impossible. What we needed from SWT to function properly on MAC simply doesn't work with carbon version of SWT. So we switched to cocoa, it looks and works much better. You will find 32 and 64 bit distributions in downloads. Enjoy!
This is the first maintenance release for v3.1, feel free to download. The release notes have more detailed information, here is a brief summary:
Happy new year everyone!
We start this year with a shiny new v3.1. There are lots of new things and fixes, see the release notes. Please make sure to read this for upgrading. I will briefly touch the most notable items:
As you might know already, Oracle officially announced JDK7. We are committed to support two recent major versions simultaneously which would be Java6 and Java7 at the moment. It also means we will officially stop supporting JDK5 from now on. If you are a paid customer and absolutely must stay with Java5, please let us know and we will send you a special build.
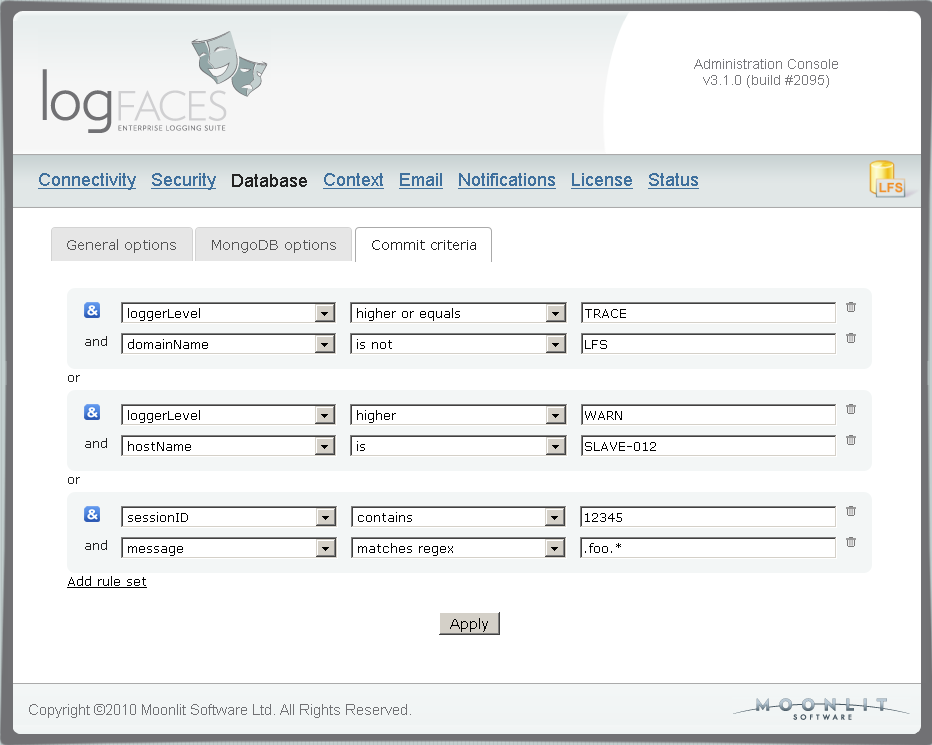
We have completely redesigned filtering mechanism capturing logs on server and client. Replaced with JEXL criteria rules, it now allows fairly complex and flexible expressions. Makes it more consistent too. This affects major admin tasks such as database, reports, triggers, as well as client views. You can use any attribute to include or exclude events - we particularly wanted to get the MDC for triggers and reports. Here is how it looks (click to enlarge):
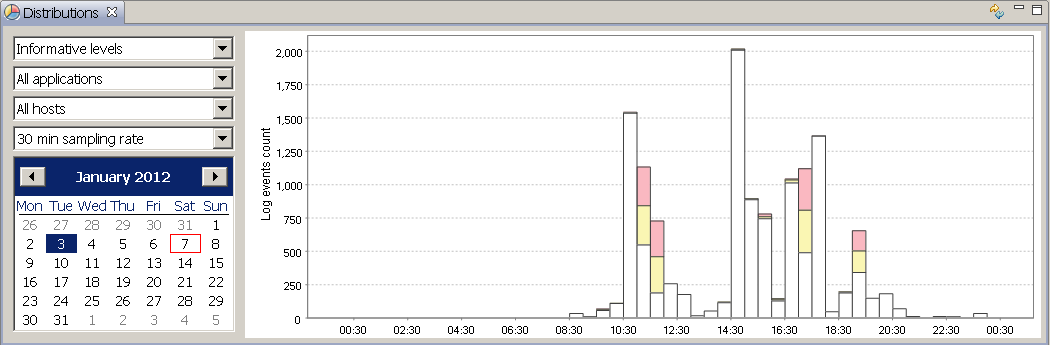
There is a new face in client called Daily Distributions, you will find it on the main toolbar. It displays log distributions in a day time-line. The distributions can be categorised by levels, exceptions, apps and hosts. See those red and yellow bars? These are errors and warnings - selecting it will instantly fetch the logs for you (click to enlarge):
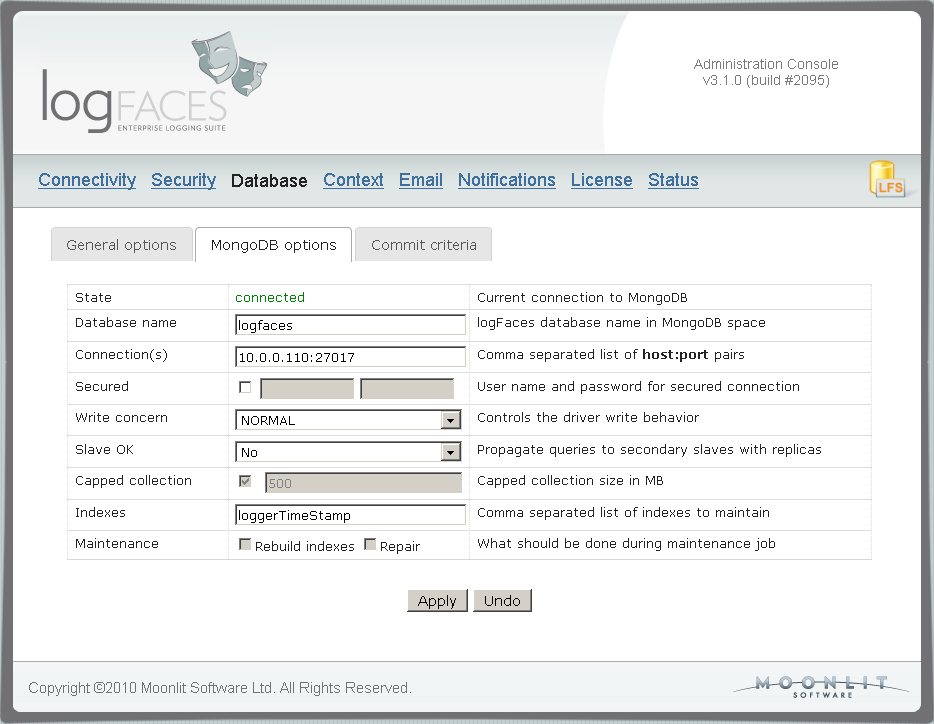
MongoDB stuff - we have added security support, upgraded and tested latest drivers, exposed all integration parameters to the admin pages with lots of tool tips and reduced all attribute names to save the storage space. Make sure you read this for upgrading. The admin page for MongoDB integration looks like this (click to enlarge):
We have added an internal appender to the server to allow self-monitoring of logFaces server by its own tools. You can now create triggers and reports on logFaces packages and classes and simply take action yourself or send them to our support.
Here is a list of bug fixes, small and not so visible improvements. We are looking forward for your feedback as usual!
Those of you who use OpenDS directory service will find this release useful. It corrects some minor compatibility issues we had with importing user groups for authorization. Now fixed, tested and ready to roll. There are no special instructions for the update.
Clients get couple of new features too. You can now customize sounds in real-time perspectives, there are few common chimes to choose from. Also, should you want to run the client and let it automatically do some query, there is a new command line argument which allows this. Could be handy for launching clients programmatically (user manual has more details on this).
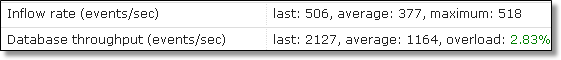
If you ever encountered overload problems with logFaces server - grab this update. We have improved the mechanism which guards the server overload when database throughput is lower than the inflow from appenders. Apparently there was a problem which made server unstable if the load spike would be too long. Also, there are some metrics added in admin/status page to help dealing with heavy loaded systems. Now you will be able to see actual inflow from appenders along with actual (and average) database throughput. This should help estimate whether your current setup is good enough for the inflow you anticipate.
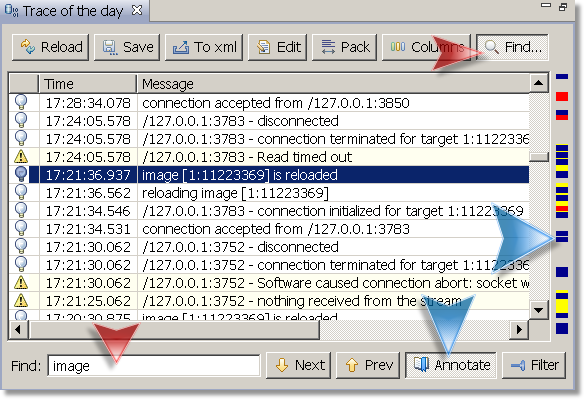
Clients get new feature - you can now do text search in queries and real-time perspectives. Aside from simple text search you will also be able to mark the search results on the side ruler or filter out the results completely. This is how it looks:
Just posted second maintenance update for v3 with several rare but important fixes. Here is the list of bugs killed, please upgrade if they are relevant to your usage pattern.
We are happy to announce a significant set of updates for the latest version. This maintenance release is now all yours!
There is an unusually long list of items we managed to address this hot summer. There are lots of improvements and bug fixes, please have a look at release notes. Here are the most notable points:
After almost two months in beta testing we are pleased to announce the release of logFaces v3.0. You will find detailed release notes and new user manual in downloads. If you're planning to upgrade from previous releases, please make sure to look in here. Briefly this is the formal list of new and noteworthy items:
Clients get a major face lift:
This is the second beta for v3.0. So far, there is quite a positive feedback, there are no major issues, except the one below:
We are beta stable with v3.0, feel free to give it a ride! Final release is due in May. There are no special installation instructions. Pre-release notes can be found here. Along with bug fixes here are the new noteworthy features:
There are couple of small updates which aren't worth version increment but still worth noting. First is a bug in server receivers which were sometimes replacing the origin host name with a localhost. And the second is in logback appender, it wasn't transmitting the throwable information properly which was resulting in missing exception causes. If you use logback - get the updated appenders.jar here and replace it in your application classpath.
Here we go, 2011 is here and I'd like to give you an update on what's going to happen this year. We're planning to release a major upgrade with two important things.
First, we've bought Wrapper Developer License (Tanuki Software) in order to be on Windows 64bit without pain and with proper support. Java Service Wrapper proved to be a fantastic piece of software, so logFaces will be shipped with latest wrapper. It will work on even more operating systems.
The second big thing is a change related to databases. Well, not a change actually, but a wider scope. In the last couple of months I've been looking into an alternative to the relational databases - so called NoSQL databases. And that proves to be an interesting alternative. Of course, logFaces will continue to work with SQL database, we are not replacing it, we're extending it.
We've already made logFaces work with MongoDB as its primary storage and I must say I'm very excited about it. MongoDB is a document database that bridges the gap between key-value stores (which are fast and highly scalable) and traditional RDBMS systems. The simplicity, elegance, performance boost and scalability are just so impressive. It feels like MongoDB was made for logFaces, just a perfect combination of technologies. It took some time to adapt new interfaces, it was quite straightforward but we had do split the code base to be operational with both SQL and NoSQL databases. That was actually more of a code refactoring than an architectural change. Comparing to the SQL sibling with its schemas, hibernates, transactions, and other heavy stuff, MongoDB looks so elegant and simple. I like that.
I like simple things that work. One limitation we've seen so far is the support for 32 bit OS's. MongoDB guys put it simple - we don't want to hassle with the old stuff but looking ahead. And what's ahead is cheap and abundant RAM, so why torture your code with limitations you know will go away soon. I like this attitude. So, MongoDB will be available to work with logFaces as soon as we finish polishing the code and complete the tests. I'll keep you informed how tests are going, we're still getting used to this new stuff, so I can't give any concrete dates. But if things don't go south, the release will be some time in the spring. If you've got something to share about your MongoDB experience, please jot me a line.
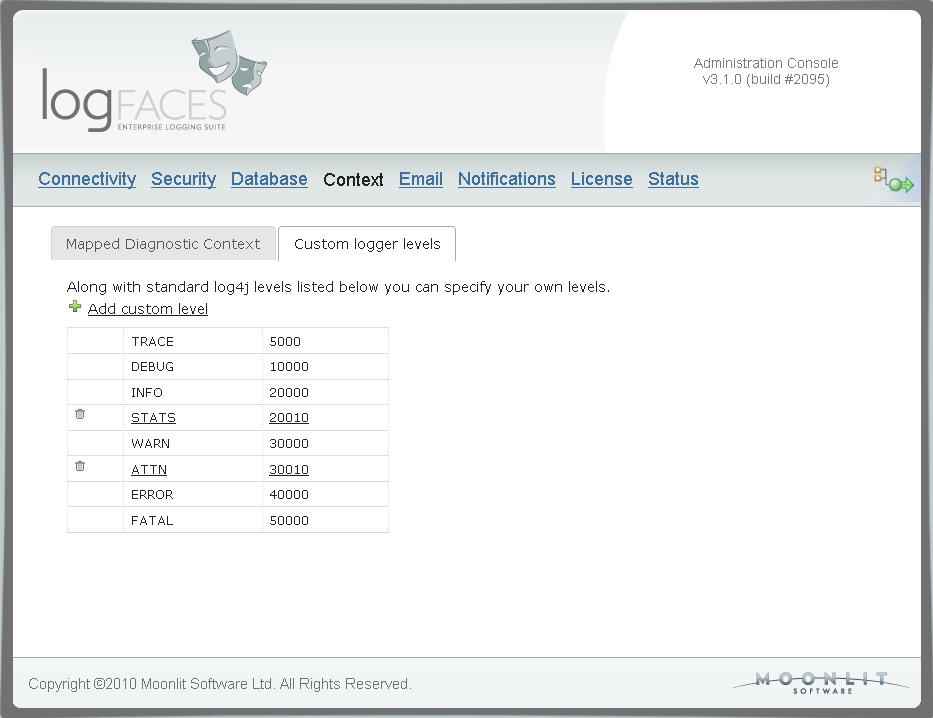
In this update we are adding support for custom levels of log events. Those of you who extend default log4j priority levels will find this update very useful. Because appenders send levels as plain numbers in XML, we had to add a mapping to support them throughout the system. In admin console you can map your own levels so that we propagate them to clients for proper display. Note that these levels can also be used in all filters - database, reports, triggers, etc. Here is the addition in admin :
Along with custom levels we also added an option to colorize your views in the way you prefer. Now you will be able to colorize log statements and specify icons to each individual level. If you hate colours, you may as well make it plain black and white. Click on the thumbnail below to see how it looks like :
There were also several minor bug fixes. The update is fully compatible with previous releases, just get the distribution binaries and update your installation. Clients, as usual, can be updated automatically from Tools menu.

